Author Affiliations
1College of Environmental Science and Engineering, Fujian Normal University, Fuzhou 350007, China2Key Laboratory of Pollution Control and Resource Recycling of Fujian Province, Fujian Normal University, Fuzhou 350007, Chinashow less
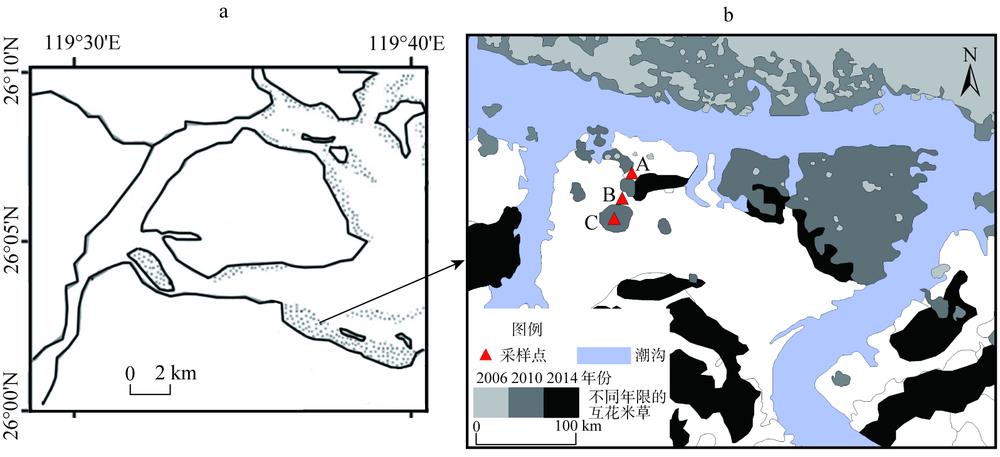
Fig. 1. Sampling sites in the research area
Fig. 2. Vertical distribution of physicochemical properties for different Spartina alterniflora invasion periods
Fig. 3. Vertical distribution of sediment heavy metals for different Spartina alterniflora invasion periods
Fig. 4. Vertical distribution of sediment heavy metals retention for different Spartina alterniflora invasion periods
| 重金属 | 样本数/个 | 范围/(mg/kg) | 平均值/(mg/kg) | 重金属 | 样本数/个 | 范围/(mg/kg) | 平均值/(mg/kg) |
|---|
| Co | 123 | 1.36~91.48 | 7.41 | Cu | 123 | 6.50~99.10 | 21.60 | | Ni | 123 | 2.30~223.40 | 13.50 | As | 123 | 0.42~35.90 | 5.78 |
|
Table 1. Background values of sediment heavy metals in the coastal zone of Fujian province
| Igeo | 分级 | 污染程度 | Igeo | 分级 | 污染程度 |
|---|
| Igeo<0 | 0 | 无污染 | 3≤Igeo<4 | 4 | 强污染 | | 0≤Igeo<1 | 1 | 无污染~轻度污染 | 4≤Igeo<5 | 5 | 强污染~极强污染 | | 1≤Igeo<2 | 2 | 中度污染 | Igeo≥5 | 6 | 极强污染 | | 2≤Igeo<3 | 3 | 中度污染~强污染 | | | |
|
Table 2. Geo-accumulation index of heavy metals and their grades in sediments
Table 3. Toxicity coefficient of different heavy metals in sediments (mg/kg)
| 潜在生态风险度 | 轻微 | 中度 | 强 | 很强 | 极强 |
|---|
| 生态风险因子 | <40 | 40≤<80 | 80≤<160 | 160≤<320 | ≥320 | | 生态风险指数RI | RI<150 | 150≤RI<300 | 300≤RI<600 | RI≥600 | — |
|
Table 4. Potential ecological risk assessment of heavy metals
| 平均 高度/m | 地上生物量/(g/m2) | 植株密度/(株/m2) | 田间持水量/% |
|---|
| A | 0.45 | 3.99×10² | 130±11 | 44.11±3.65 | | B | 1.00 | 13.45×10² | 121±10 | 43.88±8.37 | | C | 1.50 | 24.42×10² | 116±8 | 44.98±3.75 |
|
Table 5. Vegetation characteristics of the community for different Spartina alterniflora invasion periods
| 相关性评价方法 | 指标 | Co | Ni | Cu | As |
|---|
| Pearson相关 | Co | 1 | | | | | Ni | 0.697** | 1 | | | | Cu | 0.539** | 0.726** | 1 | | | As | 0.334 | 0.451** | 0.710** | 1 | | 总碳 | 0.394* | 0.308 | 0.663** | 0.479** | | 总氮 | 0.311 | 0.228 | 0.628** | 0.503** | | 碳氮比 | -0.244 | -0.207 | -0.550** | -0.434* | | 电导率 | 0.338 | 0.500** | 0.438** | 0.166 | | pH | -0.461* | -0.775** | -0.678** | -0.401* | | 容重 | -0.585** | -0.619** | -0.936** | -0.692** | | 黏粒比例 | 0.444 | 0.328 | 0.155 | 0.168 | | 粉粒比例 | 0.343 | 0.040 | -0.164 | 0.070 | | 沙粒比例 | -0.428 | -0.163 | 0.045 | -0.126 | | Spearman相关a | 地上生物量 | 1.000** | 1.000** | 1.000** | 1.000** |
|
Table 6. Correlation analysis for sediment heavy metals and other physical biochemistry characteristics in the research area
| 研究区域 | Co | Ni | Cu | As | 文献来源 |
|---|
| 鳝鱼滩 | 20.56~30.28 | 35.69~44.17 | 18.06~41.25 | 156.53~196.94 | 本文 | | 福建省海岸带沉积物重金属背景值 | 1.36~91.48 | 2.3~223.4 | 6.5~99.1 | 0.42~35.9 | [16] | | 江苏如东互花米草盐沼湿地 | — | 3.74 | 6.66 | 6.68 | [24] | | 黄河口新生湿地 | 9.7~16.1 | 24.51~40.85 | 16.85~33.87 | — | [25] | | 华东沿海滩涂 | — | — | 2.8~370 | 1.1~27.2 | [26] | | 包头市南海湿地 | — | 87.67 | 111.18 | 75.1 | [27] | | 辽河口盐沼湿地 | — | — | 24.29 | 12.23 | [28] | | 云南河流湿地 | 24.6~56.5 | 34.5~64.7 | 57.3~650 | 754~4948 | [29] | | 澳大利亚悉尼河口红树林湿地 | 0.2~23 | 0.66~48 | 1.0~206 | 0.52~35 | [30] | | 越南巴拉特河口 | — | — | 14.9~67.2 | 6.9~31.0 | [31] | | 阿根廷布拉卡海湾湿地 | — | 5.18~11.37 | 8.86~15.51 | — | [32] | | 印度贝兰杜尔湖泊湿地 | — | 15.1~138.4 | 105~1147.8 | — | [33] | | 印度马特拉河口湿地 | 46~196.7 | — | 51.8~189 | — | [34] |
|
Table 7. Comparison of heavy metal concentration between the research area in this paper and other similar research areas (mg/kg)
| 点位 | Co | Ni | Cu | As |
|---|
| A | 4.56±0.92 | 8.29±0.51 | 5.08±0.44 | 37.27±1.58 | | B | 4.80±0.18 | 8.48±0.29 | 5.48±0.32 | 38.17±4.65 | | C | 5.76±0.25 | 9.92±0.36 | 7.66±0.58 | 43.58±1.69 |
|
Table 8. Changes of heavy metals retention in wetland sediments (0-30 cm) for different Spartina alterniflora invasion periods (g/m2)
| 采样点 | Co | | Ni | | Cu | | As |
|---|
| Igeo | 级数 | Igeo | 级数 | Igeo | 级数 | Igeo | 级数 |
|---|
| A | 0.961 | 1 | | 0.881 | 1 | | -0.627 | 0 | | 4.234 | 5 | | B | 0.986 | 1 | | 0.899 | 1 | | 0.174 | 1 | | 4.260 | 5 | | C | 1.001 | 2 | | 0.998 | 1 | | 0.884 | 1 | | 4.420 | 5 |
|
Table 9. Geo-accumulation index of sediment heavy metals in the research area
| 采样点 | | RI |
|---|
| Co | Ni | Cu | As |
|---|
| A | 14.60 | 13.81 | 4.86 | 282.25 | 315.52 | | B | 14.85 | 13.98 | 5.29 | 287.44 | 321.56 | | C | 15.01 | 14.97 | 8.65 | 321.10 | 359.73 |
|
Table 10. Potential ecological risk index of sediment heavy metals in the research area