• Chinese Optics Letters
  • Vol. 18, Issue 8, 083001 (2020)
Nan Zhao1、2, Jiaming Li1、2、3、*, Qiongxiong Ma1、2、3, Liang Guo1、2、3, and Qingmao Zhang1、2、3
Author Affiliations
  • 1Guangdong Provincial Key Laboratory of Nanophotonic Functional Materials and Devices, South China Normal University, Guangzhou 510631, China
  • 2Guangzhou Key Laboratory for Special Fiber Photonic Devices, South China Normal University, Guangzhou 510631, China
  • 3Guangdong Provincial Key Laboratory of Industrial Ultrashort Pulse Laser Technology, Shenzhen 518055, China
  • show less
    DOI: 10.3788/COL202018.083001 Cite this Article Set citation alerts
    Nan Zhao, Jiaming Li, Qiongxiong Ma, Liang Guo, Qingmao Zhang. Periphery excitation of laser-induced CN fluorescence in plasma using laser-induced breakdown spectroscopy for carbon detection[J]. Chinese Optics Letters, 2020, 18(8): 083001 Copy Citation Text show less

    Abstract

    Carbon is hard to be sensitively detected in laser-induced breakdown spectroscopy (LIBS). The optical emission can be significantly enhanced by resonantly exciting CN radicals in the plasma center using LIBS assisted with laser-induced fluorescence (LIBS-LIF). However, the nitrogen source for CN formation is provided by ambient gas. Therefore, we propose a new approach of periphery excitation in plasma to improve CN fluorescence. The optical and spatial characteristics of CN radicals in plasma were discussed. A fluorescence map was established by combining focal point location and fluorescent intensity, demonstrating that plasma periphery had 4.2 times stronger fluorescence than the center.

    Carbon is a common element in the natural world. It is the fundamental composition of creatures on the earth. Moreover, carbon also plays important roles in human activity[1], determining the caloricity of fuel, the hardness of steel, the species of polymers, properties of mode-locked lasers, and so on. Therefore, carbon content analysis is a necessary process in the fields of biology[2], paleontology[3], environtology[4], fuel energy[5], and industry[6]. The conventional methods for analyzing carbon include chronometry, combustion analysis, and Fourier transform infrared spectroscopy. However, these methods are so lengthy, complicated, and time–material consuming that they are only operated in specific laboratories for offline and bulk analysis. In contrast, an in situ, rapid, non-contact, and real-time technique can make it feasible to operate in the wilds and manufacturing workshop.

    Laser-induced breakdown spectroscopy (LIBS) is a promising spectrometry based on laser ablation, in which elemental information is deduced by analyzing the spectrum emitting from laser-induced plasma on samples[7]. With lots of attractive advantages, such as fast response, in situ and remote detection[8], and minimal sample preparation, LIBS has shown great potential in Mars exploration[9], metallurgy[10], oceanology[11], agriculture[12], nuclear reaction monitoring[13], etc. However, optical emission signals of carbon in LIBS are mostly in the vacuum ultraviolet (VUV) ranges[1418], except C I 247.86 nm and 833.51 nm. To observe the VUV lines, gastight tubes or chambers with noble gas and ultralow pressure were indispensable, which complicate the operation process and give up the LIBS advantage of fast detection. C I 247.86 nm and 833.51 nm are too weak in emission intensity to realize high sensitivity[19,20], generally utilized in macro-analyzing materials with rich carbon content, such as coal[21], bio-tissue[22], and polymers[23]. Sensitive detection in micro analysis and a low-concentration sample is hardly realized.

    LIBS assisted with laser-induced fluorescence (LIBS-LIF) is a powerful modification to enhance the LIBS atomic spectrum by 2–3 orders of magnitude[24]. Another laser beam with a specific wavelength is focused onto the plasma center and resonantly excites atoms in interest. However, carbon atoms are hardly excited in LIBS-LIF because of all the excitation lines in the VUV ranges. We previously proposed a novel method for carbon excitation and observation in open air[25]. Carbon atoms from the sample and nitrogen atoms from ambient gas are combined to CN radicals in the plasma[26]. Taking the radicals as the excitation targets, carbon information can be deduced by analyzing the enhanced CN radical spectrum. Even with that, the sensitivity still needs to be improved. For example, the limit of detection (LoD) of carbon in steels was only 0.039% (mass fraction) in open air using the above method. To improve CN fluorescence in carbon detection, a new approach of periphery excitation was proposed in this Letter. The chemical reaction process, electronic/vibrational energy levels, and transitions in CN radicals in laser-induced plasma were discussed. The aim of this Letter is to realize high sensitivity of carbon detection in LIBS.

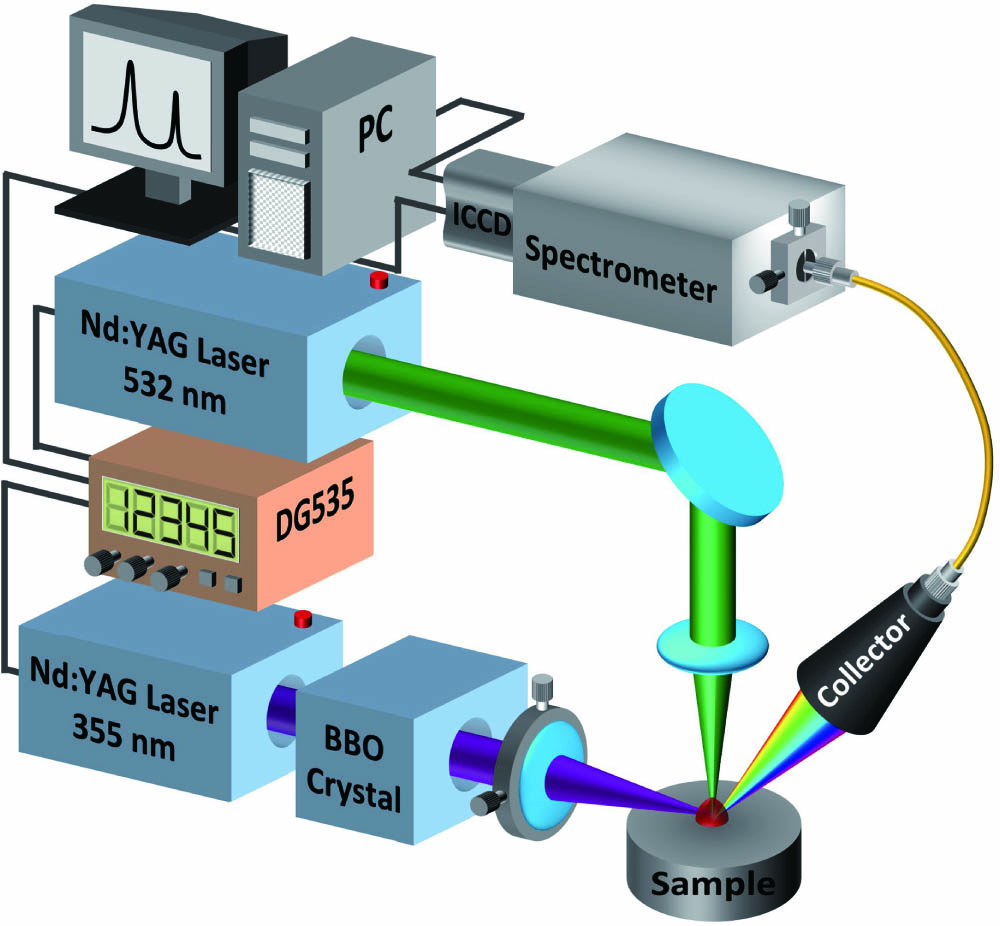
    The schematic diagram of the experimental setup in this work is shown in Fig. 1. A Q-switched Nd:Y3Al5O12 (Nd:YAG) laser (Quantel, Bigsky Ultra 100, 3 mJ, 6 ns, 532 nm, 10 Hz) pulse was used to ablate the sample surfaces and generate plasmas. The focal length and spot diameter of laser ablation were 25 mm and 100 μm, respectively. Another Q-switched Nd:YAG laser (Quantel, Brilliant, 100 mJ, 10 ns, 355 nm, 10 Hz) pulse was injected into an optical parametric oscillator (OPO) cavity with a pair of beta barium borate (BBO) crystals. The laser beam from the cavity was wavelength-tunable (402–710 nm) by changing the optical axis orientation of the BBO crystals. The second laser was focused and then radiated the plasma with a spot diameter of 200 μm. The location of the focal point at the plasma was adjusted by the lens with two micrometers. The optical emission of the plasma was collected and transmitted to a Czeny–Turner spectrometer (Andor, Shamrock 500i, grating of 2400 lines/mm). An intensified charge-coupled device (ICCD) (Andor, iStar 320T) was equipped with the spectrometer to record the spectra. Both lasers and the ICCD were synchronized by a digital delay generator (DG535). The ICCD simultaneously switched with the excitation laser pulse. To reduce the influence of laser fluctuation and improve stability, each spectrum was accumulated by 100 shots. Each point was measured repeatedly 10 times. The relative standard deviation was below 5%. A polyvinyl chloride (PVC) pellet ([CH2CHCl]n) was chosen as a typical carbon-contained sample to make a demonstration.

    Experimental setup in this work.

    Figure 1.Experimental setup in this work.

    Regardless of fine-structure energy levels in molecular rotation, the CN radicals in different electronic and vibrational levels can be described by molecular Boltzmann distribution:

    N0 is the total population of CN radicals; e and v are the electronic and vibrational levels, respectively; ge is the degeneracy; Q is the partition functions; E is level energy; T is temperature; k is Boltzmann constant. Under the local thermodynamic equilibrium (LTE) condition, the vibrational temperature is equal to the electronic temperature. Equation (1) can be expressed as

    Therefore, the population in different vibrational levels of the ground level X2Σ+ is

    The relative populations depending on temperature according to Eq. (3) are shown in Fig. 2(a). Generally, the plasma temperature in LIBS is in the range 500015,000K (shadow regions in Fig. 2). The population of the vibrational level v=1 is increasing with temperature and is close to that of the vibrational level v=0 at 500015,000K. In Fig. 2(b), the first derivative represents a variation of the relative population depending on the temperature. Obviously, the vibrational level v=1 has the lowest value, representing the best stability of population with the temperature fluctuation. Therefore, CN radicals in the vibrational level v=1 were selected as the excitation target.

    Relative population and its first derivative of CN radicals in X2Σ+.

    Figure 2.Relative population and its first derivative of CN radicals in X2Σ+.

    The transitions of the violet system (B2Σ+X2Σ+) in CN radicals[27] were used. Radiated by a 421.60 nm laser beam, the CN radicals in X2Σ+(v=1) were stimulated and transited up to B2Σ+(v=0) and then transited back to X2Σ+(v=0), emitting 388.34 nm fluorescence. Figure 3 shows the CN radical spectra of the B2Σ+X2Σ+ (0, 0) transition. Compared with the LIBS spectrum (black line), the LIBS-LIF spectrum (red line) had 305 times stronger intensity.

    Spectra of the B2Σ+−X2Σ+ (0, 0) transition acquired by LIBS (black line) and LIBS-LIF (red line).

    Figure 3.Spectra of the B2Σ+X2Σ+ (0, 0) transition acquired by LIBS (black line) and LIBS-LIF (red line).

    Generally, the excitation laser is focused on the plasma center, where the highest particle density locates. But, the CN radical behaves differently in the plasma, whose forming process needs a nitrogen source provided by the ambient gas (air). The chemical reaction process is shown in Fig. 4. After laser ablation [Fig. 4(a)], the nitrogen in ambient gas is atomized at the plasma periphery[28,29] [Fig. 4(b)], determining where the carbon and nitrogen atoms react [Fig. 4(c)]. Fewer CN radicals enter the plasma center, resulting in lower CN radical density in the center. Therefore, resonant excitation at the plasma center in the conventional way can only obtain weaker fluorescence. In contrast, periphery excitation can stimulate denser CN radicals [Fig. 4(d)].

    Process of laser-induced CN fluorescence in LIBS: (a) ablation, (b) atomization, (c) combination, and (d) excitation.

    Figure 4.Process of laser-induced CN fluorescence in LIBS: (a) ablation, (b) atomization, (c) combination, and (d) excitation.

    To make a demonstration, an XY coordinate system is defined and shown in Fig. 5. The focal point of laser excitation on the plasma was adjusted and scanned by moving the focal lens with a driver of the two precise micrometers. The scanning resolution was 200 μm. Each spectrum was recorded with its location of the excitation laser focal point.

    Self-defined XY coordinate system on the plasma.

    Figure 5.Self-defined XY coordinate system on the plasma.

    Combining the fluorescent intensities and the excitation location information, a map is established in Fig. 6 to describe the spatial distribution in plasma. The nitrogen source from the ambient gas was atomized at the plasma periphery. Less nitrogen entered into the plasma center to form CN radicals, resulting in the central dip (point A) of fluorescent intensity on the map, where the excitation was operated in conventional LIBS-LIF. Moreover, a higher temperature and plasma shield effect may also influence CN formation in the plasma center. In contrast, the map showed a ring with higher fluorescent intensity at the plasma periphery. As Fig. 4 described, the periphery had denser atomized nitrogen, where carbon atoms and nitrogen atoms combined to form CN radicals. The fluorescent intensity was also weak at the outer periphery. Because carbon was atomized at the plasma center, fewer carbon atoms could spread to the outer periphery. Denser atoms of carbon and nitrogen were both necessary for stronger CN fluorescence.

    Intensity map of CN B2Σ+−X2Σ+ (0, 0) 388.34 nm with different excitation points at the plasma.

    Figure 6.Intensity map of CN B2Σ+X2Σ+ (0, 0) 388.34 nm with different excitation points at the plasma.

    At the top of the periphery (point B, X=0mm, Y=0.6mm), the fluorescent intensity reached a peak value. The probable reason is vertical laser ablation, resulting in more atomization at the laser propagation path. Compared with conventional excitation point A in the map, the fluorescent intensity in optimized point B was improved by 4.2 times. The spectral enhancement factor of LIF was optimized to be 1281 in LIBS.

    In summary, a new approach of periphery excitation was proposed to further improve carbon sensitivity in LIBS-LIF. Conventionally, the excitation location is at the plasma center. However, carbon and nitrogen combined at the plasma periphery because the nitrogen source was provided by the ambient gas. The spatial characteristic of resonant excitation at the plasma was investigated, demonstrating that the periphery excitation had 4.2 times stronger fluorescence than the center excitation. The LIF enhancement factor was optimized to 1281. This Letter provides an effective method to realize high sensitivity for carbon detection in LIBS. Further investigation on detailed mechanism and simulation of CN spatial characteristics under different experimental conditions will be conducted in the future.

    References

    [1] Z. Dong, R. Xu, W. Zhang, H. Guoyu, L. Hua, J. Tian, Y. Song. Chin. Opt. Lett., 16, 081402(2018).

    [2] D. Codron, J. Codron, J. A. Lee-Thorp, M. Sponheimer, D. de Ruiter, J. Sealy, R. Grant, N. Fourie. J. Zool., 273, 21(2007).

    [3] B. Thomas, S. Taylor. Expert Rev. Proteom., 16, 881(2019).

    [4] A. Novara, L. Gristina, G. Sala, A. Galati, M. Crescimanno, A. Cerdà, E. Badalamenti, T. La Mantia. Sci. Total Environ., 576, 420(2017).

    [5] Y. Román Gómez, R. Cabanzo Hernández, J. E. Guerrero, E. Mejía-Ospino. Fuel, 226, 536(2018).

    [6] C. Borchers, M. Lenz, M. Deutges, H. Klein, F. Gärtner, M. Hammerschmidt, H. Kreye. Mater. Design, 89, 369(2016).

    [7] C. Shen, N. Zhao, J. Pribošek, M. Ma, L. Fang, X. Huang, Y. Zhang. Chin. Opt. Lett., 17, 123002(2019).

    [8] H. Guo, Z. Zhu, T. Wang, N. Chen, Y. Liu, J. Zhang, H. Sun, J. Liu, R. Li. Chin. Opt. Lett., 16, 033201(2018).

    [9] R. Wiens, S. Maurice, J. Lasue, O. Forni, R. Anderson, S. Clegg, S. Bender, D. Blaney, B. Barraclough, A. Cousin. Spectrochim. Acta B, 82, 1(2013).

    [10] L. X. Sun, H. B. Yu, Z. B. Cong, Y. Xin, Y. Li, L. F. Qi. Spectrochim. Acta B, 112, 40(2015).

    [11] J. Guo, A.-S. Mahmoud, N. Li, J. Song, R. Zheng. Plasma Sci. Technol., 21, 034022(2019).

    [12] R. X. Yi, L. B. Guo, X. H. Zou, J. M. Li, Z. Q. Hao, X. Y. Yang, X. Y. Li, X. Y. Zeng, Y. F. Lu. Opt. Express, 24, 2607(2016).

    [13] G. S. Maurya, R. Kumar, A. Kumar, A. K. Rai. Spectrochim. Acta B, 126, 17(2016).

    [14] X. Jiang, P. Hayden, J. T. Costello, E. T. Kennedy. Spectrochim. Acta B, 101, 106(2014).

    [15] V. Sturm, L. Peter, R. Noll. J. Appl. Spectrosc., 54, 1275(2000).

    [16] M. A. Khater, J. T. Costello, E. T. Kennedy. J. Appl. Spectrosc., 56, 970(2002).

    [17] M. Hemmerlin, R. Meilland, H. Falk, P. Wintjens, L. Paulard. Spectrochim. Acta B, 56, 661(2001).

    [18] L. Peter, V. Sturm, R. Noll. Appl. Opt., 42, 6199(2003).

    [19] S. M. Zaytsev, A. M. Popov, N. B. Zorov, T. A. Labutin. Spectrochim. Acta B, 118, 37(2016).

    [20] T. A. Labutin, S. M. Zaytsev, A. M. Popov, N. B. Zorov. Opt. Express, 22, 22382(2014).

    [21] S. Sheta, M. S. Afgan, Z. Hou, S.-C. Yao, L. Zhang, Z. Li, Z. Wang. J. Anal. At. Spectrom., 34, 1047(2019).

    [22] M. Baudelet, L. Guyon, J. Yu, J. P. Wolf, T. Amodeo, E. Frejafon, P. Laloi. Appl. Phys. Lett., 88, 063901(2006).

    [23] S. Barbier, S. Perrier, P. Freyermuth, D. Perrin, B. Gallard, N. Gilon. Spectrochim. Acta B, 88, 167(2013).

    [24] J. Li, X. Liu, X. Li, Q. Ma, N. Zhao, Q. Zhang, L. Guo, Y. Lu. Opt. Laser Eng., 124, 105834(2020).

    [25] J. Li, Z. Zhu, R. Zhou, N. Zhao, R. Yi, X. Yang, X. Li, L. Guo, X. Zeng, Y. Lu. Anal. Chem., 89, 8134(2017).

    [26] Z. H. Zhu, J. M. Li, Z. Q. Hao, S. S. Tang, Y. Tang, L. B. Guo, X. Y. Li, X. Y. Zeng, Y. F. Lu. Opt. Express, 27, 470(2019).

    [27] R. W. B. Pearse, A. G. Gaydon, R. W. B. Pearse, A. G. Gaydon. The Identification of Molecular Spectra(1976).

    [28] X. Bai, F. Cao, V. Motto-Ros, Q. Ma, Y. Chen, J. Yu. Spectrochim. Acta B, 113, 158(2015).

    [29] Y. Tian, E. B. Sokolova, R. G. Zheng, Q. L. Ma, Y. P. Chen, J. Yu. Spectrochim. Acta B, 114, 7(2015).

    Nan Zhao, Jiaming Li, Qiongxiong Ma, Liang Guo, Qingmao Zhang. Periphery excitation of laser-induced CN fluorescence in plasma using laser-induced breakdown spectroscopy for carbon detection[J]. Chinese Optics Letters, 2020, 18(8): 083001
    Download Citation