
Liang Zhang, Junjun Tan, Quanbing Pei, Shuji Ye. Film Thickness and Surface Plasmon Tune the Contribution of SFG Signals from Buried Interface and Air Surface†[J]. Chinese Journal of Chemical Physics, 2020, 33(5): 532
- Chinese Journal of Chemical Physics
- Vol. 33, Issue 5, 532 (2020)
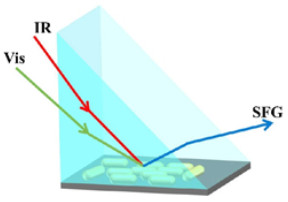
Fig. 1. A schematic of the near-total-internal-reflection geometry.
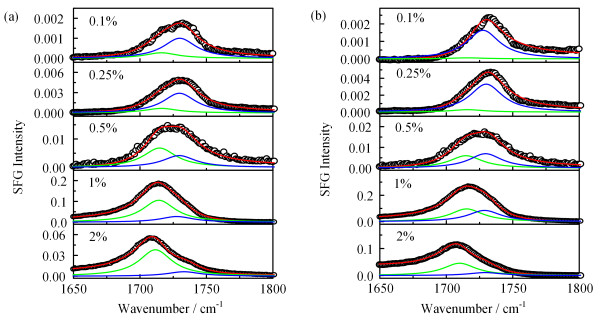
Fig. 2. The SFG spectra of the carbonyl groups of CaF2 substrate-supported PMMA films prepared with different concentration (0.1 wt%, 0.25 wt%, 0.5 wt%, 1.0 wt%, and 2.0 wt%). (a) ssp and (b) ppp.
Fig. 3. The SFG spectra in the C-H stretching region of CaF2 substrate-supported PMMA films prepared with different concentrations (0.1 wt%, 0.25 wt%, 0.5 wt%, 1.0 wt%, and 2.0 wt%). (a) ssp and (b) ppp.
Fig. 4. The fitting strength ratios of (a) $\chi _{\textrm{Peak1}}^{(2)}/\chi _{\textrm{Peak2}}^{(2)}$ and (b) $\chi _{{\rm{ppp}}}^{(2)}/\chi _{{\rm{ssp}}}^{(2)}$ are plotted against solution concentrations used in film preparation.
Fig. 5. (a) The relation between the
Fig. 6. The SFG spectra of the carbonyl groups of CaF2-Au nanorod-supported PMMA films prepared with different concentration (0.1 wt%, 0.25 wt%, 0.5 wt%, 1.0 wt%, and 2.0 wt%). (a) ssp and (b) ppp.
Fig. 7. The fitting strength ratio of $\chi _{\textrm{Peak1}}^{(2)}/\chi _{\textrm{Peak2}}^{(2)}$ is plotted against solution concentrations used in film preparation. The solid circle represents Au-PMMA films and the empty circle represents the pure PMMA films.


Set citation alerts for the article
Please enter your email address

© Copyright 2018-2021 | Chinese Laser Press. All Rights Reserved 沪ICP备15018463号-20