
Ying Li, Guang-Kun Zhang, Zi-Gen Song. Entrainment mechanism of the cyanobacterial circadian clock induced by oxidized quinone[J]. Chinese Physics B, 2020, 29(9):
- Chinese Physics B
- Vol. 29, Issue 9, (2020)
![Phase shifts induced by oxidized quinone pulse sensed by KaiA. A 4 h pulse is added at CT = 3 h [(a), (d)], CT = 9 h [(b), (e)], and CT = 16 h [(c), (f)], respectively. The kinetic trajectories of the total concentration of phosphorylated KaiC (P-KaiC), which is the sum of S-KaiC, T-KaiC and D-KaiC, are shown in (a)–(c). The corresponding orbits are shown and projected onto the T–S plane over a full circadian cycle (d)–(f). The gray bar represents the duration of adding oxidized quinone.](/richHtml/cpb/2020/29/9/098703/img_1.jpg)
Fig. 1. Phase shifts induced by oxidized quinone pulse sensed by KaiA. A 4 h pulse is added at CT = 3 h [(a), (d)], CT = 9 h [(b), (e)], and CT = 16 h [(c), (f)], respectively. The kinetic trajectories of the total concentration of phosphorylated KaiC (P-KaiC), which is the sum of S-KaiC, T-KaiC and D-KaiC, are shown in (a)–(c). The corresponding orbits are shown and projected onto the T–S plane over a full circadian cycle (d)–(f). The gray bar represents the duration of adding oxidized quinone.
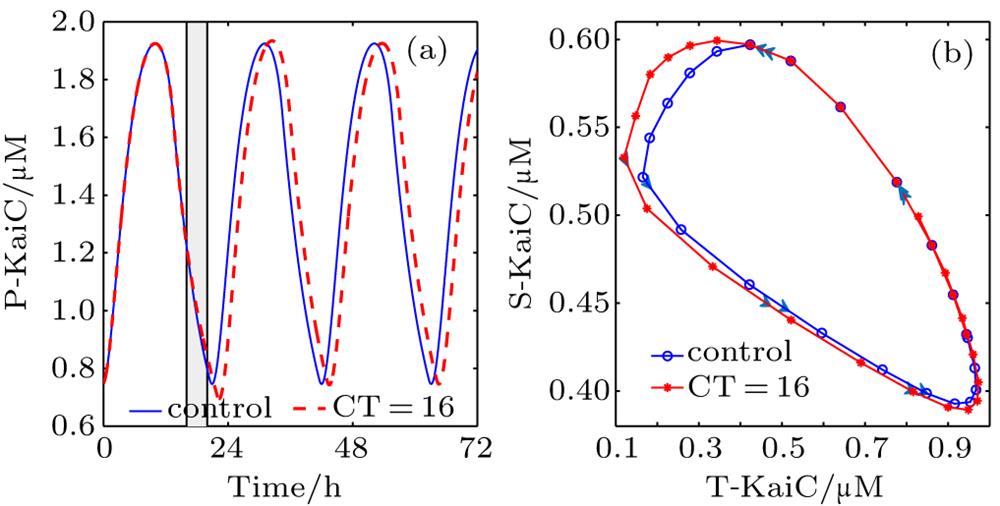
Fig. 2. Phase shift induced by oxidized quinone pulse sensed by CikA. A 4 h pulse is added at CT = 16 h. The kinetic trajectories of P-KaiC before and after the pulse are shown in (a), and the corresponding orbits projected onto the T–S plane over a full circadian cycle are shown in (b). The gray bar represents the duration of adding oxidized quinone.
Fig. 3. The phase response curve (PRC) of the circadian clock. The horizontal axis represents the circadian time when oxidized quinone pulse is added. Negative (positive) phase shifts correspond to phase delay (advance). The blue line with circles indicates the situation where KaiA senses oxidized quinone with Qu = 0.3 (μM) and the red line with rectangles indicates that CikA senses oxidized quinone with Qu = 0.6 (μM). The pulse duration is 1 h.
Fig. 4. Effects of varying the amount of oxidized quinone on phase shifts. Oxidized quinone are added at CT = 8 h and CT = 19 h sensed by KaiA [(a), (b)] and CikA [(c), (d)], respectively. The time courses of P-KaiC and PRCs for various amount of oxidized quinone are shown in [(a), (c)] and [(b), (d)], respectively. The gray bar represents the duration of adding oxidized quinone, which is 2 h.
Fig. 5. Effects of varying the pulse duration (PD) of oxidized quinone on phase shifts. Pulses with different durations of oxidized quinone are added at CT = 8 h and CT = 19 h sensed by KaiA [(a), (b)] and CikA [(c), (d)], respectively. The time courses of P-KaiC and PRCs are shown in [(a), (c)] and [(b), (d)], respectively. Here Qu = 0.2 (μM) in [(a), (b)] and 0.4 (μM) in [(c), (d)].
Fig. 6. PRCs of circadian oscillators with different inherent periods (T 0), which are 21.1 h, 24.0 h and 26.9 h, respectively, and [KaiA] = 1.07 (μM), 1.159 (μM) and 1.235 (μM) accordingly. Oxidized quinone is sensed by KaiA (a)–(c) and CikA, which senses oxidized quinone only in the dephosphorylation phase (d)–(f), respectively. The signal duration is 1 h in [(a), (d)], 2 h in [(b), (e)] and 4 h in [(c), (f)]. The asterisk, cross and plus sign represent the peak phosphorylation points of the three circadian oscillators, respectively. Here Qu = 0.2 (μM) in (a)–(c) and 0.4 (μM) in (d)–(f).
Fig. 7. Entrainment of cyanobacterial circadian clock regulated by oxidized quinone cycle. The blue solid lines and the red dotted lines represent the oscillators without and with oxidized quinone cycle, respectively. The jagged line shows oxidized quinone cycle (12:12), where the high level represents oxidized quinone pulse (12 h) and the low level represents that there is no oxidized quinone (12 h). Oxidized quinone is sensed by KaiA (a) and CikA (b), respectively.
Fig. 8. Mixture effects of KaiA and CikA on the entrainment of circadian clock. The circadian clock can not be entrained when the signal strength of oxidized quinone, sensed by one of KaiA or CikA, is not strong enough (a). However, it can be entrained when oxidized quinone is sensed by both KaiA and CikA (b). The time evolution curves of P-KaiC with varying Qu are shown in (c), which shows the entrainment phase difference between the circadian clock and oxidized quinone cycle. (d) Circadian cycles are projected onto T–S plane. The jagged line is the same as that in Fig.7 .

Set citation alerts for the article
Please enter your email address
© Copyright 2018-2021 | Chinese Laser Press. All Rights Reserved 沪ICP备15018463号-20