• Acta Photonica Sinica
  • Vol. 51, Issue 10, 1012001 (2022)
Wei ZHAO1, Yu CHEN1, Zhongyan HU1, Chen ZHANG1..., Guiren WANG2, Kaige WANG1,* and Jintao BAI1|Show fewer author(s)
Author Affiliations
  • 1Institute of Photonics and Photon-Technology,State Key Laboratory of Photon-Technology in Western China Energy,National Center for International Research of Photoelectric Technology & Nano-functional Materials and Application,Laboratory of Optoelectronic Technology of Shaanxi Province,Northwest University,Xi'an 710127,China
  • 2Department of Mechanical Engineering and Program of Biomedical Engineering,University of South Carolina,Columbia,South Carolina 29208,USA
  • show less
    DOI: 10.3788/gzxb20225110.1012001 Cite this Article
    Wei ZHAO, Yu CHEN, Zhongyan HU, Chen ZHANG, Guiren WANG, Kaige WANG, Jintao BAI. Development and Applications of Laser Induced Fluorescence Photobleaching Anemometer(Invited)[J]. Acta Photonica Sinica, 2022, 51(10): 1012001 Copy Citation Text show less
    Schematic diagram of velocity measurement by µPIV
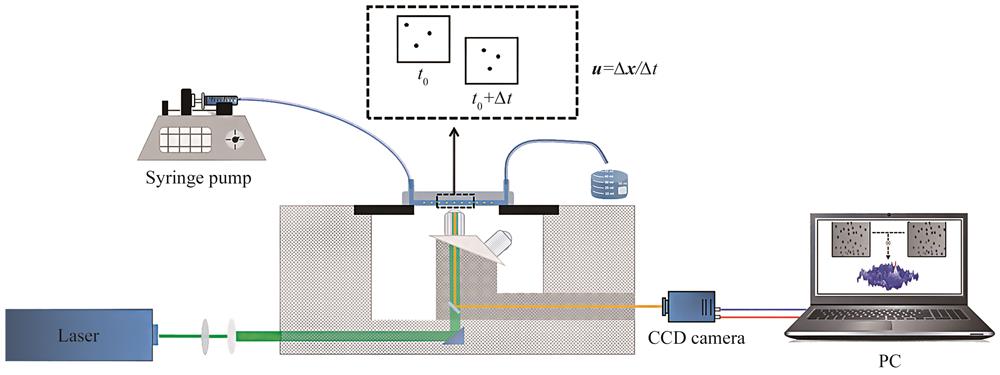
    Fig. 1. Schematic diagram of velocity measurement by µPIV
    Schematic diagram of laser grid for MTV
    Fig. 2. Schematic diagram of laser grid for MTV
    Schematic diagram of typical OCT
    Fig. 3. Schematic diagram of typical OCT
    Schematic diagram of MRV velocity measurement for gas flow profiling in open-cell foams[90]
    Fig. 4. Schematic diagram of MRV velocity measurement for gas flow profiling in open-cell foams90
    Schematic diagram of velocity measurement by LIFPA
    Fig. 5. Schematic diagram of velocity measurement by LIFPA
    Velocity calibration curve of LIFPA[95]
    Fig. 6. Velocity calibration curve of LIFPA95
    Schematic diagram of a typical LIFPA system based on different microscopes
    Fig. 7. Schematic diagram of a typical LIFPA system based on different microscopes
    Normalized fluorescent intensity distribution If,local̑ along streamwise direction(x)at different flow velocity under a high K[102]
    Fig. 8. Normalized fluorescent intensity distribution If,local̑ along streamwise direction(x)at different flow velocity under a high K102
    Parametrical studies on the photobleaching time constant[97,102]
    Fig. 9. Parametrical studies on the photobleaching time constant97102
    Velocity profiles in cylindrical and rectangular microchannels[104]
    Fig. 10. Velocity profiles in cylindrical and rectangular microchannels104
    Velocity profile in a nanocapillary[93]
    Fig. 11. Velocity profile in a nanocapillary93
    Measuring the rise time of electroosmotic flow and its distribution in a microcapillary[105]
    Fig. 12. Measuring the rise time of electroosmotic flow and its distribution in a microcapillary105
    Diagram of the electrokinetic micromixer and the experimental results on velocity field[100]
    Fig. 13. Diagram of the electrokinetic micromixer and the experimental results on velocity field100
    Statistics of velocity and velocity structures[101]
    Fig. 14. Statistics of velocity and velocity structures101
    Diagram of ACEOF microchannel and the experimental results by LIFPA[95]
    Fig. 15. Diagram of ACEOF microchannel and the experimental results by LIFPA95
    Time series of dimensionless velocity fluctuations in oscillating electroosmotic flow[109]
    Fig. 16. Time series of dimensionless velocity fluctuations in oscillating electroosmotic flow109
    Velocity power spectra at different AC frequency and the influence of the control parameters on the state of the electroosmotic flow[113]
    Fig. 17. Velocity power spectra at different AC frequency and the influence of the control parameters on the state of the electroosmotic flow113

    Velocity

    measurement

    techniques

    PrinciplesSpecifications

    Applications and

    requirements

    µPIVTaking particle images in the field of interest. Calculating the displacements of particles between two adjacent frames. Then,by dividing the time interval of the two adjacent images,the velocity field can be obtained

    √ 2D/3D velocity field

    √ Non-invasive

    √ Euler representation

    √ Relatively high temporal(~30 μs)and spatial(order of μm)resolutions

    × Suffers the influence of particle lagging and electric field

    Need to add particle tracers in the working fluid,appropriate for gas or liquid with good transparency,e.g. water,blood,oil and etc
    PTVTaking particle images in the field of interest. Calculating the displacements of particles between two adjacent frames. Then,by dividing the time interval of the two adjacent images,the velocity field can be obtained

    √ 2D/3D velocity field

    √ Non-invasive

    √ Lagrange representation

    √ Velocity field near complex boundary

    √ Translational and rotational velocity fields

    √ Relatively high temporal(~30 μs)and spatial(~submicrons)resolutions

    √ Suffers the influence of particle lagging and electric field

    Need to add particle tracers in the working fluid,appropriate for gas or liquid with good transparency,e.g. water,blood,oil and etc
    MTVMark the flow field which is mixed with long-lifetime fluorescent molecules by laser-induced fluorescence with modulated light patterns,e.g. parallel lines,grids,spot array/matrix. Monitoring the movement/deformation of the patterns by taking images. Calculating the displacement of flow through the movement/deformation of the patterns between two adjacent images. Then,the velocity field can be calculated based on the displacement and the time interval of two adjacent images

    √ 2D velocity field

    √ Non-invasive

    √ Tracing the flow by long-lifetime fluorescent molecules. Visualize the flow field simultaneously.

    √ Avoid the influence of particle lagging and electric field

    × Complex algorithms

    × Relatively low temporal resolution(~ms),but high spatial resolution(~submicrons)in microfluidics

    × Inappropriate for continuous measurement in complex and temporally fluctuated flow fields

    Need to add long-lifetime fluorescent dye in the working fluid,appropriate for gas or liquid with good transparency
    OCTCapturing the images of particles in the flow field by OCT. Calculating the displacements of particles between two adjacent frames. Then,by dividing the time interval of the two adjacent images,the velocity field can be obtained

    √ 2D velocity field

    √ Non-invasive

    √ Appropriate for low-transparency fluids

    × Relatively high spatial resolution(order of μm),but poor temporal resolution

    × Proper particle concentration in the fluids

    Low-transparency fluids with particles/cells/tissues and etc,e.g. biofluids
    MRVCapturing the images of particles/samples in the flow field by Magnetic Resonance Imaging. Calculating the displacements of particles/samples between two adjacent frames. Then,by dividing the time interval of the two adjacent images,the velocity field can be obtained

    √ 2D velocity field

    √ Non-invasive

    √ Appropriate for non-transparent fluids

    × Low temporal and spatial(order of mm)resolutions

    × A strong magnetic field is applied during imaging of the flow field,where metallic materials should be avoided

    Non-transparent fluids with particles/cells/tissues/bubbles and etc,e.g. biofluids
    LIFPACalculating flow velocity by measuring the fluorescence after photobleaching,relying on the velocity-fluorescence relationship

    × 1D velocity magnitude

    × Single point

    × Need calibration

    √ Non-invasive

    √ High temporal resolution(order of μs)

    √ High/Super spatial resolution(~200 nm/70 nm)

    √ Avoid the influence of particle lagging and electric field

    Need to add fluorescent dye with relatively poor photostability in the working fluid,appropriate for uniform liquid with good transparency and low autofluorescence
    Table 1. Common flow velocity measurement techniques in microfluidics
    Diameter/μmExperimental/msTheoretical/msDeviation/%
    500.690.4360
    751.391.0137
    Table 2. τr in the center of microcapillary channels with different inner diameters105
    Wei ZHAO, Yu CHEN, Zhongyan HU, Chen ZHANG, Guiren WANG, Kaige WANG, Jintao BAI. Development and Applications of Laser Induced Fluorescence Photobleaching Anemometer(Invited)[J]. Acta Photonica Sinica, 2022, 51(10): 1012001
    Download Citation