
Min-Jie Diwu, Xiao-Mian Hu. Molecular dynamics simulation of shock-induced isostructural phase transition in single crystal Ce [J]. Acta Physica Sinica, 2020, 69(11): 116202-1
- Acta Physica Sinica
- Vol. 69, Issue 11, 116202-1 (2020)
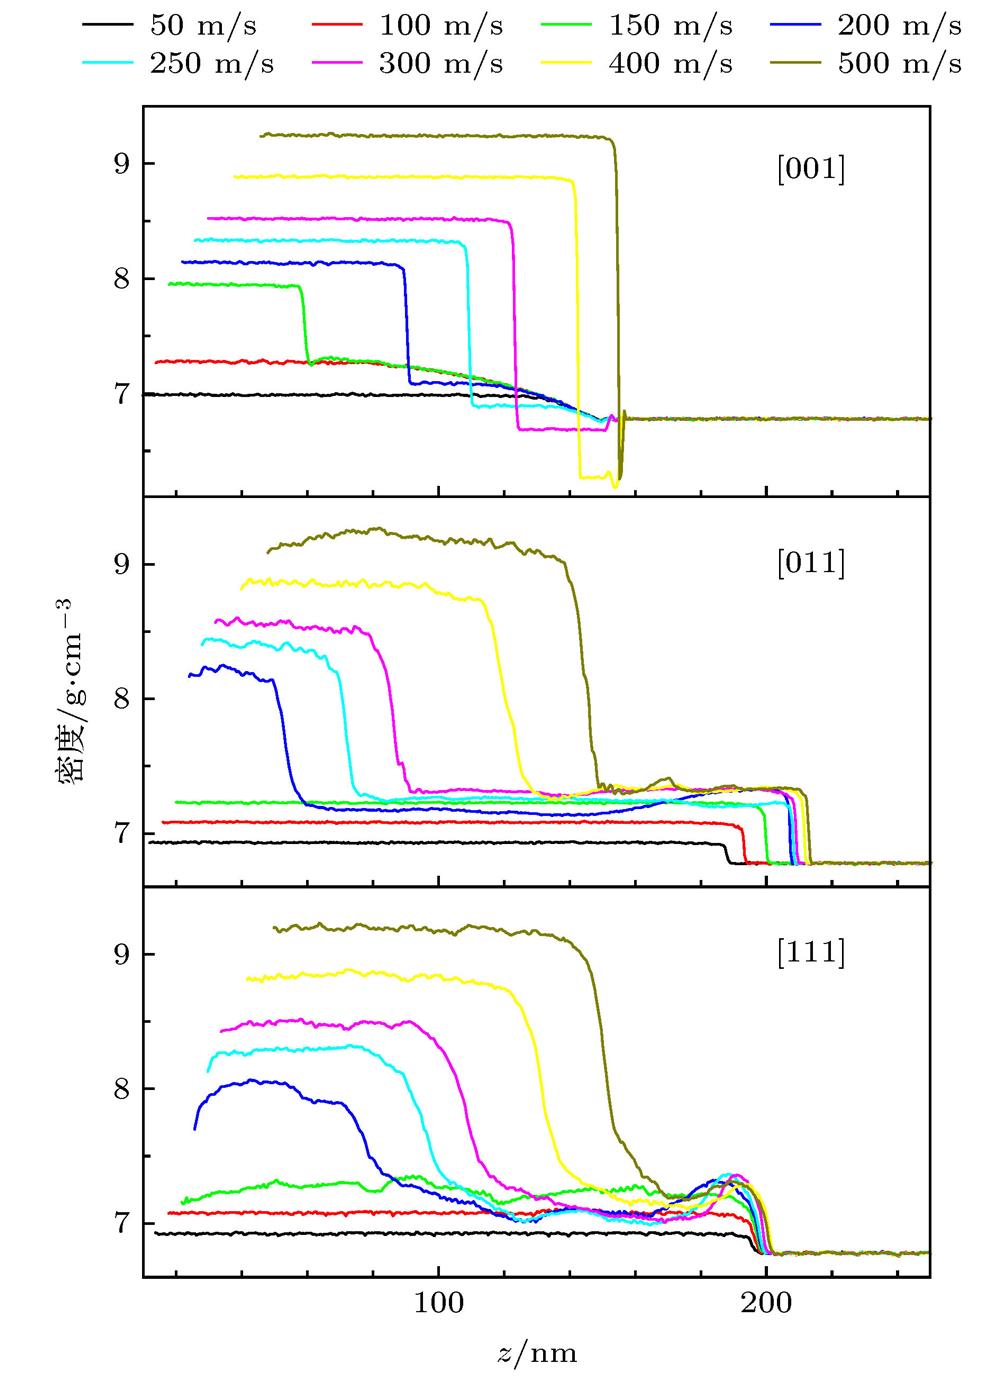
Fig. 1. Density profiles of different loading orientation and strength (u p) for t = 80 ps.
![Microstructure of the sample shocked along [111]: (a) All atoms are shown; (b) only non-fcc atoms are shown. Color coding: Green for local fcc atoms; red for hcp; blue for bcc. Dislocations are illustrated with tubes in (b): Green for Shockley partials; deep blue for perfect fcc dislocations; light blue for stair-rod dislocations. up = 150 m·s–1, t = 80 ps.](/richHtml/wlxb/2020/69/11/20200323/img_2.jpg)
Fig. 2. Microstructure of the sample shocked along [111]: (a) All atoms are shown; (b) only non-fcc atoms are shown. Color coding: Green for local fcc atoms; red for hcp; blue for bcc. Dislocations are illustrated with tubes in (b): Green for Shockley partials; deep blue for perfect fcc dislocations; light blue for stair-rod dislocations. u p = 150 m·s–1, t = 80 ps.
Fig. 3. Microstructure of the shocked samples. The shock orientation is along (a) [001], (b) and (c) [011], (d) and (e) [111], respectively. Atoms in fcc structure are hidden in (c) and (e).u p = 200 m·s–1, t = 80 ps.
Fig. 4. Shock Hugoniot for single crystal Ce: (a) Shock speed vs . piston velocity; (b) pressure vs . particle velocity. Experimental data is cited from Ref.[20]. The
 symbol in (b) represents the statistical standard error.
symbol in (b) represents the statistical standard error. Fig. 5. Pressure profile for each loading orientation at u p = 200 m·s–1 and t = 80 ps.
Fig. 6. Temperature-pressure condition of shock-induced and hydrostatic phase transition.
Fig. 7. Radial distribution function of the sample before and after the shocks.
Fig. 8. Phase boundary of shock induced transition. Shock orientation: (a) [001]; (b) [011]; (c) [111]. The atoms of fcc structure with larger atomic volume are hidden.u p = 200 m·s-1, t = 80 ps.
Fig. 9. Microstructure of the sample after phase transition shock along [001] with listed piston velocity: (a) u p[001] = 150 m·s–1; (b) u p[001] = 200 m·s–1; (c) u p[001] = 250 m·s–1; (d) u p[001] = 300 m·s–1; (e) u p[001] = 400 m·s–1; (f) u p[001] = 500 m·s–1.
Fig. 10. Comparison of the energy along tetragonal deforma-tion path (atomic volume preserved) and the path of constant a .
|
Table 1. Parameters of single crystal Ce sample for MD simulation.
|
Table 2.
Fraction for each type of microstructure (analyzed with PTM algorithm) in the part after phase transition shock along [001] (%).
[001]晶向加载相变波后区域微结构组分(依据PTM分析)(%)

Set citation alerts for the article
Please enter your email address
© Copyright 2018-2021 | Chinese Laser Press. All Rights Reserved 沪ICP备15018463号-20