
Mario Zitelli, Vincent Couderc, Mario Ferraro, Fabio Mangini, Pedro Parra-Rivas, Yifan Sun, Stefan Wabnitz, "Spatiotemporal mode decomposition of ultrashort pulses in linear and nonlinear graded-index multimode fibers," Photonics Res. 11, 750 (2023)
- Photonics Research
- Vol. 11, Issue 5, 750 (2023)
Abstract
1. INTRODUCTION
In recent years, there has been a resurgence of interest in studying nonlinear effects in multimode optical fibers (MMFs), both for their application and fundamental science perspectives [1,2]. Among these, the surprising observation of spatial beam self-cleaning induced by the Kerr effect in graded-index (GRIN) MMFs has attracted significant attention [3,4]. Analogous, but different in nature from Raman beam clean-up [5], beam self-cleaning consists of the reshaping, as the input power is increased, of the multimode speckled transverse intensity profile at the output of the fiber into a bell-shaped beam close to the fundamental mode of the fiber, sitting on a low-intensity multimode background [3].
Spatial beam self-cleaning can be exploited to substantially improve the beam quality at the output of MMFs, a property which is of interest for high-peak power beam delivery, mode-locked fiber lasers [6,7], and high-resolution imaging systems [8,9], to cite a few. To date, several models have been proposed for describing the physical mechanism of Kerr self-cleaning, including nonlinear nonreciprocal mode coupling [3], self-organized instabilities [10], 2D hydrodynamic turbulence [11], beam condensation [12,13], and, last but not least, beam thermalization [14]. In a thermodynamic framework, the multimode beam is represented as a gas of indistinguishable particles, that populates the large, but finite number of spatial modes of the fiber. This approach is powerful, since it permits the exploitation of the conservation laws (e.g., the number of particles, or power, the linear momentum, and the orbital angular momentum), which are inherent to virtually lossless beam propagation in short lengths of fiber. By exploiting the tools of statistical mechanics, one may then describe beam self-cleaning as the irreversible evolution of the gas of photons toward its state of thermal equilibrium. This is identified by the definition of thermodynamic parameters, such as the temperature (
In the thermodynamic approach, the role of nonlinearity is merely that of inducing, via four-wave mixing, the exchange of photons among nondegenerate fiber modes, in analogy with particle collisions in a gas [14]. However, it has been noted that mode energy exchanges leading to thermal equilibrium are greatly facilitated by the presence of random linear mode coupling (RMC) [18,19]. The question then arises: is nonlinearity a necessary ingredient for thermalization in highly MMFs, or can linear disorder do the job by itself? And in this case, what is the expected output mode power distribution? In Raman fiber laser experiments based on kilometer-long spans of GRIN MMF, it has been observed that the highly multimode pump beam reaches a steady-state distribution that corresponds to mode equipartition [20–22]; whereas in a recent work, the roles of nonlinear and linear mode coupling have been systematically studied, by artificially varying the strength of linear disorder in an MMF [23]. These experiments confirmed that linear and nonlinear coupling processes may lead to different thermalization regimes, which are consistent with either the mode equipartition (when linear disorder prevails) or a Rayleigh–Jeans (RJ) distribution (when nonlinearity dominates). In Ref. [23], strong linear disorder was introduced by applying a stress to the MMF via a series of clamps. It remains to be studied what is the role of the linear disorder which is inherent to standard telecommunication GRIN fibers, owing to the presence of microbends that lead to nearest-neighbor coupling of power among adjacent nondegenerate modes [24], and its interplay with a weak fiber nonlinearity.
Sign up for Photonics Research TOC. Get the latest issue of Photonics Research delivered right to you!Sign up now
This is the purpose of this work: by applying a novel time-resolved mode decomposition technique, which permits measuring with unprecedented accuracy the energy fraction of higher-order modes, we could determine the evolution of the mode power distribution in long lengths (up to 5 km)
In the former three cases, linear random mode coupling prevails over weakly nonlinear mode mixing in determining the steady-state mode power distribution, which is a realistic case in most applications. Surprisingly, our observations reveal that, even in these regimes, no mode equipartition was observed in GRIN fibers. To the contrary, the long-distance mode distribution converges toward a thermalized state, that is quantitatively well described by an exponential decay versus mode energy, as described by a Bose–Einstein (BE) distribution. Note that a similar exponential mode power distribution was recently observed for the Stokes beam in a Raman fiber laser; however, in that case mode-dependent gain has a significant influence in determining the equilibrium mode distribution [22]. In the soliton case, beam condensation in the fundamental fiber mode and pulse narrowing were observed. Here the mode power distribution approaches the Rayleigh-Jeans law, albeit with a slightly larger depletion of higher-order modes. Our experiments revealed the occurrence of a sudden change of the output modal distribution, from the BE to a quasi-RJ law, when a temporal soliton is forming. This finding provides, we believe for the first time, an experimental evidence of a distribution transition, which occurs in long spans of multimode optical fiber when passing from a linear-disorder dominated and pseudo-linear dispersive propagation regime, to a soliton regime.
2. THEORY
Modes of GRIN fibers are defined in terms of radial and azimuthal numbers (
In order to verify the accuracy of a mode decomposition, it is necessary to perform a reconstruction of the output near-field intensity pattern. When using 2D modal decomposition methods such as in Ref. [26], it is challenging to properly reconstruct the output near field of ultrashort pulses propagating over long fiber lengths, because of the temporal variation of the mode envelope phases. Such variations are due to (i) the chromatic dispersion-induced phase chirp of pulses carried by different modes; (ii) the mode dispersion-induced group delay among modes; and (iii) the laser-induced phase noise.
To overcome these difficulties, it is necessary to adopt a 3D mode field reconstruction method which accounts for all of the previously listed effects, which enables us to reconstruct both the near-field transverse intensity pattern and the temporal power traces, emerging from long spans of GRIN fibers. Our 3D field reconstruction method uses the experimental output power fractions
Pulse envelopes
3. EXPERIMENTAL RESULTS
In our experiments, we used relatively long (up to 5 km) spans of commercial GRIN OM4 fiber, with
Several coherent sources were alternatively used at the fiber input: a 70 fs pulse source at 1550 nm wavelength, 100 kHz repetition rate, obtained from an optical parametric amplifier fed by a femtosecond Yb laser; a 1.4 ps unchirped pulse source, obtained from the 70 fs pulses by narrow bandpass filtering; a CW distributed feedback (DFB) laser with 1 nm linewidth at 1460 nm. The input beam was attenuated, linearly polarized, and passed through a
At the fiber output, a microlens focused the near field on an InGaAs camera (Hamamatsu C12741-03); a second lens focused the beam into a real-time multiple octave spectrum analyzer (Fastlite Mozza) with a spectral detection range of 1100–5000 nm. The output pulse temporal shape was inspected by a fast photodiode (Alphalas UPD-35-IR2-D) and a real-time oscilloscope (Teledyne Lecroy WavePro 804HD) with 30 ps overall response time. An intensity autocorrelator (APE pulseCheck 50) with femtosecond resolution was also used for the characterization of the input pulses. An
Figure 1 shows the results of a first test, performed with unchirped 1.4 ps pulses at 1550 nm, propagating over 5 km of GRIN fiber. No diffuser was used at the input, and the beam lateral shift was limited to 4 μm. In this case, fiber chromatic dispersion broadens the pulse up to 285 ps, whereas modal dispersion separates the mode groups by up to 9 ns. The total pulse energy in the fiber was 100 pJ, which corresponds to
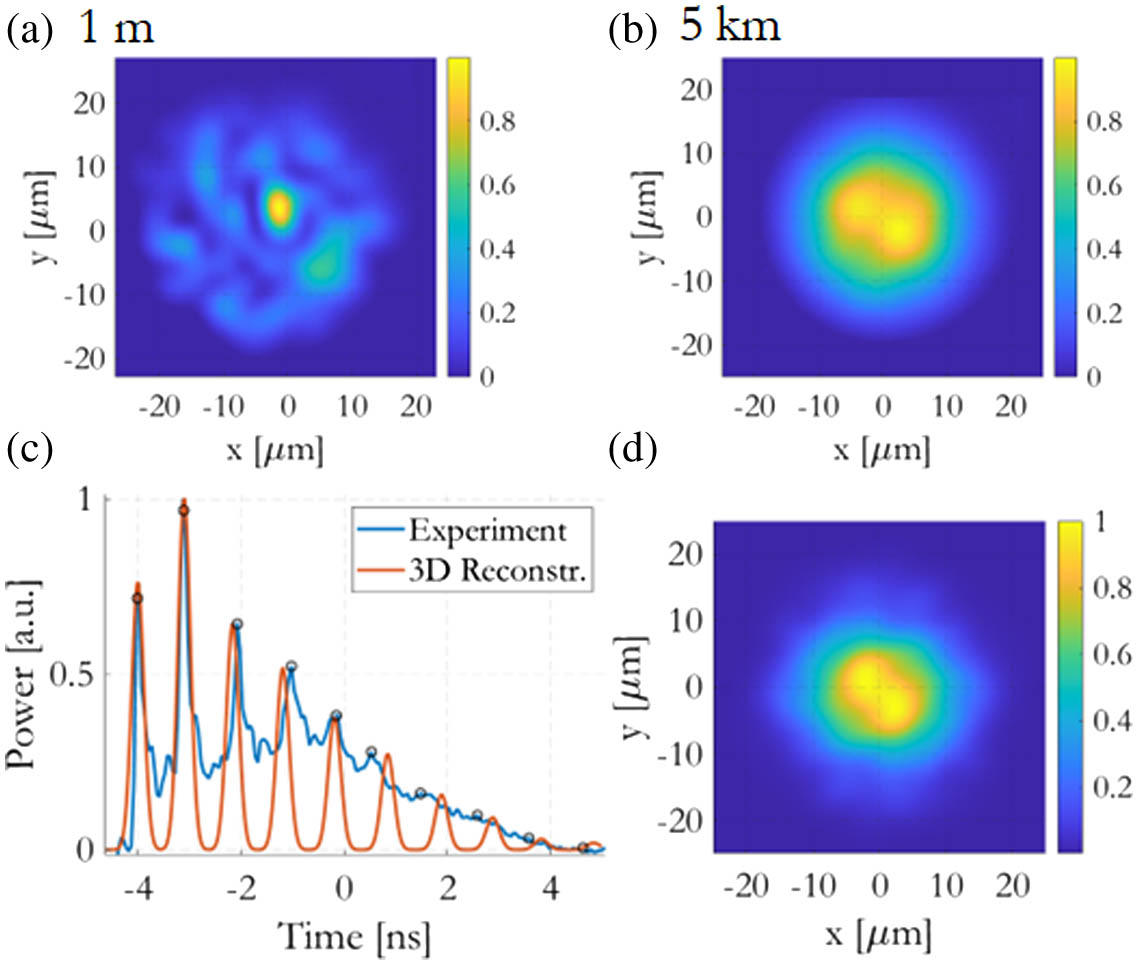
Figure 1.Experiments with 1 m and 5 km of GRIN MMF, 1.4 ps pulses at 1550 nm, 100 pJ pulse energy, lateral shift of 4 μm. (a) Measured near field at 1 m. (b) Measured near field at 5 km. (c) Instantaneous power at 5 km (measured and reconstructed). (d) Reconstructed near field at 5 km.
The measured near field after 1 m of fiber, shown in Fig. 1(a), is characterized by a highly speckled intensity pattern, denoting the presence of a large number of modes. On the other hand, after 5 km of propagation [Fig. 1(b)], a much brighter (nearly bell-shaped) beam is observed. The output power measured after 5 km is illustrated in Fig. 1(c), blue curve, showing a train of temporally broadened pulses, corresponding to the propagated mode groups (up to 10 among them are visible).
A mode decomposition (MD) for the mode powers was obtained by directly measuring the total degenerate mode group power from the photodiode response, and dividing it by the number of modes in that group; in this way one readily obtains the mean power fraction of individual modes in a degenerate group
![]()
Figure 2.(a) Mean power fractions for test with 1.4 ps, 5 km, 100 pJ, shift 4 μm. (b) Test with 70 fs, 830 m, 100 pJ, shift 15 μm. (c)
Figure 1(d) shows the near field after 5 km of pulse propagation, reconstructed by using the 3D method, based on the measured
In a second test, unchirped 70 fs pulses at 1550 nm were propagated over 830 m of GRIN fiber; no diffuser was used at the input, and the beam lateral shift was extended up to 15 μm with respect to the fiber axis. In this case the input pulse energy was limited to 100 pJ, giving a peak power of 1.3 kW. Because of the strong dispersive spreading, the effective nonlinear interaction length is only
Figure 3(a) shows the measured near field after 6 m of fiber, which reflects the highly multimodal distribution that is injected at the fiber input. After 830 m of propagation, the measured near field of Fig. 3(b) shows a homogeneous, bell-shaped output beam. The experimental instantaneous power after 830 m in Fig. 3(c), blue curve, shows a 1100 ps pulse with a trailing tail. Here chromatic dispersion is responsible for pulse broadening up to 947 ps, whereas modal dispersion introduces a 0.19 ps/m delay among adjacent mode groups. Experimentally, the overall dispersion introduces a total pulse broadening of up to 1100 ps. As a result, the different pulses belonging to nondegenerate mode groups remain strongly overlapped in time at the fiber output. Yet, it is still possible to recover the mode power distribution by sampling the measured instantaneous power at the appropriate modal delays for each mode group. After dividing these values by the number of modes in each group, one obtains the mode power distribution of Fig. 2(b) (black circles). Again, the measured mode power distribution permits, in combination with the 3D simulation method and by setting random mode phases, the reconstruction of the transverse near-field intensity profile after 830 m of GRIN fiber, as shown in Fig. 3(d). The corresponding simulated temporal power profile is reported as an orange curve in Fig. 3(c). The good reconstruction in both spatial and temporal dimensions confirms the correct sampling of the mode group powers in Fig. 3(c).
![]()
Figure 3.Experiment with 6 and 830 m of GRIN MMF, 70 fs pulses at 1550 nm, 100 pJ pulse energy, and lateral input beam offset of 15 μm. (a) Measured near field at 6 m. (b) Measured near field at 830 m. (c) Instantaneous power at 830 m (measured and reconstructed). (d) Reconstructed near field at 830 m.
Figures 2(a) and 2(b) show that the modal mean power fractions can be properly fitted by exponential curves. Recall that experiments in Fig. 2(a) were conducted in a propagation regime which was initially dominated by nonlinearity, followed by a much longer propagation distance where linear disorder completely prevails; whereas experiments in Fig. 2(b) were only weakly affected by nonlinearity even initially. In Figs. 2(a) and 2(b) we compare experimental results against different theoretical distributions, specifically, the RJ law, the exponential MB law, and the BE law of Eq. (1). In both cases, the BE distribution better approximates the experimental data up to the ninth mode group; whereas the RJ law is not suitable for describing the output mode distribution, since it fails to fit the data after the fifth mode group. The MB exponential distribution also fits well the data. By considering the BE law as the appropriate distribution, we computed the modal temperature
For the second experiment (70 fs over 830 m in the pseudo-linear regime), Fig. 2(b) illustrates the mean power fractions when the input beam is coupled with nominal 15 μm lateral shift with respect to the fiber axis: as can be seen, also in this case the BE law fits very well the data. Figure 2(d) shows that, when varying the input lateral shift from 0 to 15 μm,
Finally, we underline that, at variance with the approximation of mode degeneration, in our experiments we found that the values of
In order to test a case where beam propagation occurs in the strictly linear regime, we used a CW laser source at 1460 nm. Figure 4 shows examples of measured near-field intensity profiles after 1 m, 830 m, and 5 km of GRIN fiber, respectively. At the input, a beam diffuser was added; moreover, the beam center was nominally laterally offset by 15 μm with respect to the fiber axis. The CW input power was of only 1 μW, corresponding to
![]()
Figure 4.Experiments with 1 m, 830 m, and 5 km of GRIN fiber, with input CW beam at 1460 nm, 1 μW power, an input beam diffuser, and a lateral shift of 15 μm.
Previous experiments involved either highly dispersive pulses, of the CW propagation regime. In the former cases, the influence of the temporal dimension on the final output power distribution can be simply taken into account by considering an effective nonlinear length. This is no longer the case when the input pulse powers increased up to the point of forming multimode GRIN solitons [31,33,34]. To explore the soliton regime and the resulting output mode power distribution, input 70 fs pulses with energies ranging from 0.2 to 1.5 nJ were propagated over 5 km of GRIN fiber. The input beam was coupled with 10 μm lateral shift with respect to the fiber axis. At 1.3 nJ of input pulse energy, the pulse starts forming a multimode soliton [34]. We observed that, for input pulse powers slightly below the soliton value, the output beam was spatially compressed, while its temporal duration broadened to a few hundreds of femtoseconds. Yet, a Raman-shifted walk-off soliton did not emerge; we will refer to this state as the quasi-soliton regime. As soon as the walk-off soliton energy was reached (around 1.5 nJ at 1550 nm, not shown), nearly all of the output pulse energy emerged in the fundamental fiber mode.
Figure 5 compares the dispersive pulse regime with the quasi-soliton pulse regime. In the latter, Fig. 5(e), there is no Raman-induced pulse delay, and a soliton has not yet separated from its residual dispersive waves; hence, a time-resolved modal decomposition is still possible. Figures 5(a)–5(c) show the measured near field, the output power (with sampled mode group powers), and the mean mode power fractions, respectively, in the dispersive pulse propagation regime. An output beam waist of 13.5 μm and a beam quality factor
![]()
Figure 5.Experiments with 5 km of GRIN MMF, 70 fs pulses at 1550 nm, lateral shift of 10 μm. (a)–(c) Measured near field, output power, and mean modal power fraction for input pulse energy of 200 pJ. (d)–(f) Measured near field, output power, and mean modal power fraction for input pulse energy of 1.3 nJ, corresponding to the formation of a multimode soliton.
4. DISCUSSION AND CONCLUSIONS
In this work, a time-resolved MD technique was used, in order to analyze the output mode power distributions after long spans of GRIN fibers. We considered four different propagation regimes, i.e., purely linear, pseudo-linear, dispersive nonlinear, and soliton regimes. Our 3D MD and reconstruction method accounts for phase chirping, modal delay, and random complex mode scrambling, induced by propagation on the complex amplitude of the spatiotemporal field. The accuracy of the method was confirmed by successfully reconstructing the output field, both in the spatial and in the temporal domains. Comparisons among the experimental MD based on fast photodiode traces, the 3D modal reconstructions, and fitting of the output modal content, have shown that the BE law is the most appropriate for describing long-distance multimode fiber propagation for both dispersive nonlinear and quasi-linear regimes, in the presence of random mode coupling. Similar results in terms of near-field transverse intensity profiles were obtained in a purely linear propagation regime, although no direct confirmation of the output mode power distribution was possible in this case.
It was also observed that the multimode soliton regime is characterized by a different mode power distribution, which approaches the RJ law. The BE distribution, observed in a regime where linear disorder prevails over a weak nonlinearity, reveals the presence of a high-temperature thermalization process, where the input power is diffused out of the fundamental mode into higher-order modes. To the contrary, spatiotemporal beam condensation is approached in the soliton regime, and the output mode power distribution approaches the RJ law in this case, in agreement with former studies of Kerr-driven spatial beam self-cleaning. The difference in the two observed distributions could be related to a glassy regime [35], caused by the nonlinearity affected by the linear disorder; this property will be investigated in a future work.
We underline that the exponential decay of the mode power fraction must not be confused with the classical Maxwell–Boltzmann law. Indeed, in the latter, the gas particles are supposed to be distinguishable. Whereas our experiments involve indistinguishable photons in the fiber modes, whose thermalization process occurs before the mode distinguishability provided by the modal walk-off.
Acknowledgment
Acknowledgment. We acknowledge helpful discussions with G. Steinmeyer about using either the RJ or the BE law for describing the mode power distribution of high-order fiber modes.
References


Set citation alerts for the article
Please enter your email address

© Copyright 2018-2021 | Chinese Laser Press. All Rights Reserved 沪ICP备15018463号-20