
Ke-Wu Qi, Yu-Hong Zhao, Hui-Jun Guo, Xiao-Lin Tian, Hua Hou. Phase field crystal simulation of the effect of temperature on low-angle symmetric tilt grain boundary dislocation motion [J]. Acta Physica Sinica, 2019, 68(17): 170504-1
- Acta Physica Sinica
- Vol. 68, Issue 17, 170504-1 (2019)
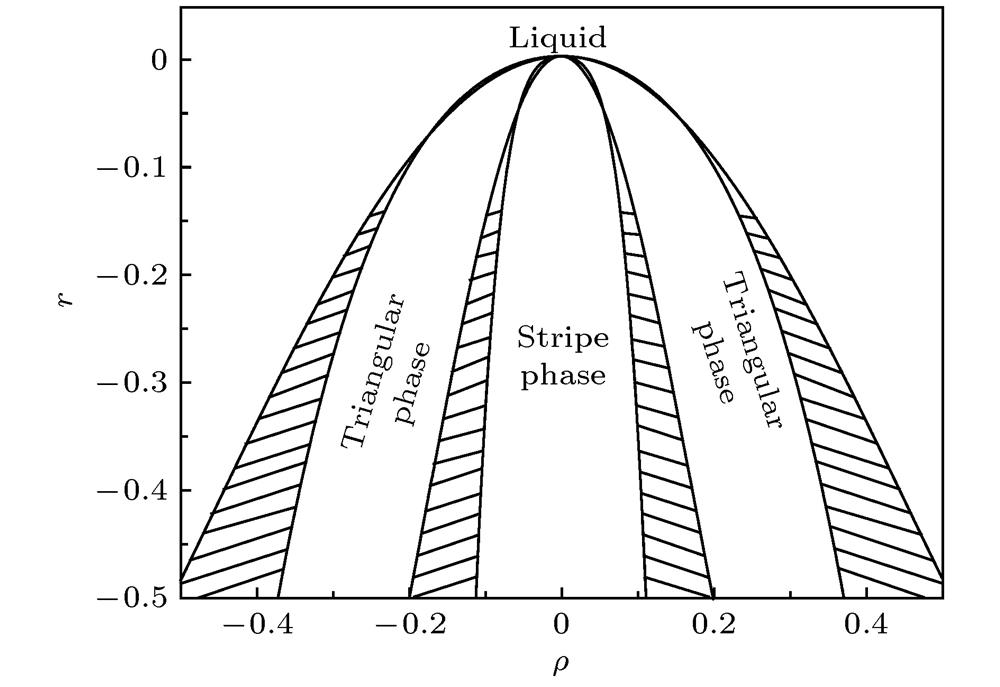
Fig. 1. Two-dimensional phase diagram as calculated in a one-mode approximation (hatched areas in the figure correspond to coexistence regions).单模近似下的二维相图(图中阴影部分表示两相区)
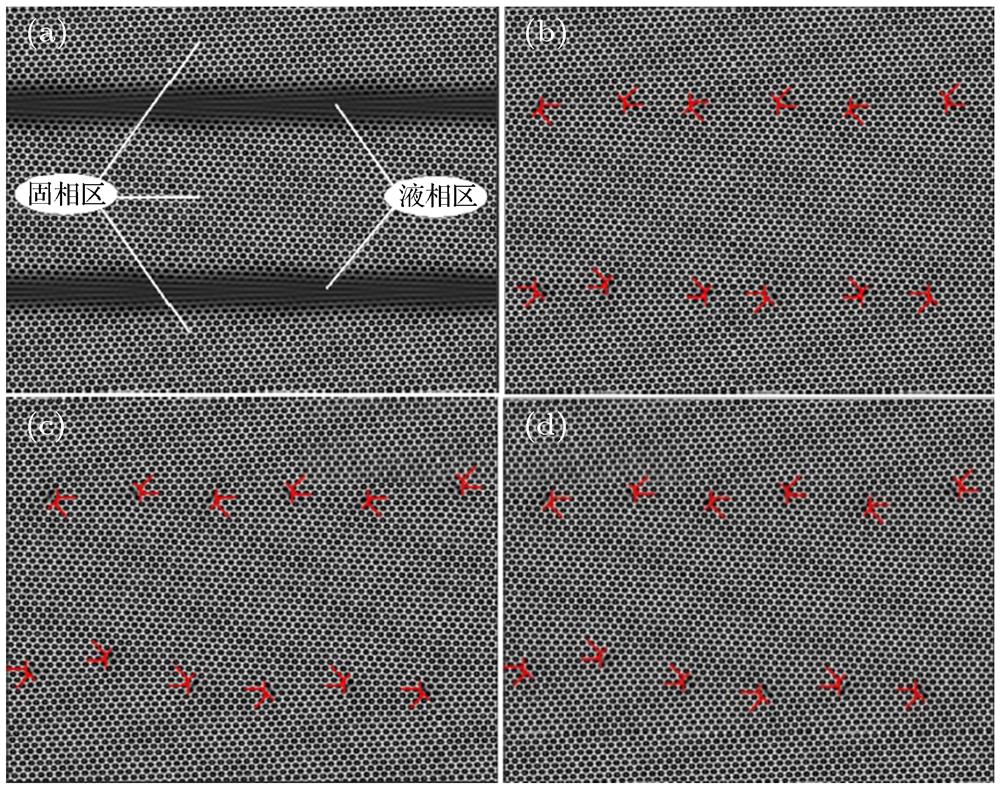
Fig. 2. Simulation of relaxation process under the conditions of temperature r = –0.25 at (a) n = 300, (b) n = 800, (c) n = 15000, (d) n = 29450.
r = –0.25条件下弛豫过程模拟 (a) n = 300; (b) n = 800; (c) n = 15000; (d) n = 29450
Fig. 3. Snapshot of two grains with an orientation angle of 2.8°.两晶粒形成夹角为2.8°的位向角
Fig. 4. Simulation of grain boundary dislocation under different temperature conditions at 29500 steps of relaxation process: (a) r = –0.23; (b) r = –0.25; (c) r = –0.28; (d) r = –0.30
弛豫过程29500步时不同温度条件下晶界位错模拟图 (a) r = –0.23; (b) r = –0.25; (c) r = –0.28; (d) r = –0.30
Fig. 5. Effect of temperature on the change of free energy of relaxation process system.温度对弛豫过程体系自由能变化的影响
Fig. 6. Simulation diagram of grain boundary dislocation motion under stress with r = –0.23: (a) n = 5500; (b) n = 10900; (c) n = 11350; (d) n = 13350; (e) n = 13850; (f) n = 24450.
应力作用下r = –0.23时晶界位错运动模拟图 (a) n = 5500; (b) n = 10900; (c) n = 11350; (d) n = 13350; (e) n = 13850; (f) n = 24450
Fig. 7. Simulation diagram of grain boundary dislocation motion under stress with r = –0.25: (a) n = 11100; (b) n = 11550; (c) n = 13600; (d) n = 13850; (e) n = 14100; (f) n = 25150.
应力作用下r = –0.25时晶界位错运动模拟图 (a) n = 11100; (b) n = 11550; (c) n = 13600; (d) n = 13850; (e) n = 14100; (f) n = 25150
Fig. 8. Simulation diagram of grain boundary dislocation motion under stress with r = –0.28: (a) n = 11800; (b) n = 12050; (c) n = 13800; (d) n = 29050; (e) n = 33450; (f) n = 33700.
应力作用下r = –0.28时晶界位错运动模拟图 (a) n = 11800; (b) n = 12050; (c) n = 13800; (d) n = 29050; (e) n = 33450; (f) n = 33700
Fig. 9. Simulation diagram of grain boundary dislocation motion under stress with r = –0.30: (a) n = 11300; (b) n = 12100; (c) n = 12500; (d) n = 39550; (e) n = 40100; (f) n = 76500.
应力作用下r = –0.30时晶界位错运动模拟图 (a) n = 11300; (b) n = 12100; (c) n = 12500; (d) n = 39550; (e) n = 40100; (f) n = 76500
Fig. 10. Simulation diagram under different temperature conditions at n = 11200: (a) r = –0.23; (b) r = –0.25; (c) r = –0.28; (d) r = –0.30.
11200步时不同温度条件下的模拟图 (a) r = –0.23; (b) r = –0.25; (c) r = –0.28; (d) r = –0.30
Fig. 11. Free energy curve of system under different degrees of temperature: (a) r = –0.23; (b) r = –0.25; (c) r = –0.28; (d) r = –0.30
不同温度下体系自由能曲线图 (a) r = –0.23; (b) r = –0.25; (c) r = –0.28; (d) r = –0.30
|
Table 1. Parameters used in the simulation.

Set citation alerts for the article
Please enter your email address
© Copyright 2018-2021 | Chinese Laser Press. All Rights Reserved 沪ICP备15018463号-20