1SZU-NUS Collaborative Innovation Centre for Optoelectronic Science & Technology, and Key Laboratory of Optoelectronic Devices and Systems of Ministry of Education and Guangdong Province, College of Optoelectronic Engineering, Shenzhen University, Shenzhen 518060, China
2Faculty of Information Technology, Macau University of Science and Technology, Macao
3Key Laboratory for Micro-Nano Optoelectronic Devices of Ministry of Education, College of Physics and Microelectronic Science, Hunan University, Changsha 410082, China
We experimentally investigated the nonlinear optical response in few-layer oxidized black phosphorus (OBP) by the femtosecond Z-scan measurement technique, and found that OBP not only possesses strong ultrafast saturable absorption but also a nonlinear self-defocusing effect that is absent in black phosphorus (BP). The saturable absorption property originates mainly from the direct band structure, which is still maintained in OBP. The emergence of self-defocusing might originate from the combined consequences of the oxygen-induced defects in BP. Our experimental findings might constitute the first experimental evidence on how to dynamically tuneits nonlinear property, offering an inroad in tailoring its optical properties through chemical modification (oxidation, introducing defects, etc.). The versatile ultrafast nonlinear optical properties (saturable absorption and self-defocusing) imply a significant potential of the layered OBP in the development of unprecedentedoptoelectronic devices, such as mode lockers, optical switches, laser beam shapers, and wavelength converters.China Postdoctoral Science Foundation (2015M580731); Science and Technology Planning Project of Guangdong Province (2016B050501005).
Two-dimensional (2D) materials have been under extensive investigation, because of their unique opto-electronic properties and the dimensionality effect, in association with promising technological applications, such as modulators, transistors, and mode lockers [1,2]. Particularly, the emergence of graphene has started an avalanche of exploration to take advantage of its novel properties for applications at the nanoscale. In the current post-silicon era, graphene has been generally considered the most promising building block for electronic or optoelectronic devices [3–5]. However, the metallic band structure of graphene can delimit the scope of applications, especially toward the regime where higher current on–off ratio is compulsory. A finite bandgap is essentially important for the fabrication of devices including transistors, optical modulators, and optical detectors. In the meantime, graphene shows relatively weak absorption (2.3% of incident light per atomic layer), which brings up limitations, such as a small absolute value (approximately 1%) of optical modulation depth [6,7], and weak photon detection efficiency. The lack of energy bandgap in graphene has led to the search for other 2D materials beyond graphene. Transition metal dichalcogenides (TMDs) have a relatively higher absorbance at a particular wavelength due to the resonant absorption (up to ), and show thickness-dependent bandgaps ( for bulk and for monolayer). However, TMDs are indirect bandgap semiconductors and can become the direct bandgap semiconductor only in its monolayer form with optical response mainly in the visible range due to a moderate bandgap [8].
Black phosphorus (BP) is a monoatomic semiconducting layered material, and has recently attracted renewed attention because of its high carrier mobility [9], thickness-dependent optoelectronic response [10], anisotropic photo-electronic response [11], mechanical properties [12], and abundant chemical reactivity [13–15]. Different from graphene and TMDs, BP is always a type of direct energy bandgap semiconductor with a bandgap of 2 eV in its monolayer and a bulk-state bandgap of 0.3 eV [16,17]. The moderate and direct energy bandgap in BP makes it able to bridge the gap between semiconducting graphene and wide-bandgap semiconducting TMDs, and therefore brings up new opportunities for infrared (IR) photonics and optoelectronics [18]. The anisotropic feature of BP adds a new dimension of angle-dependent optoelectronic and electronic devices, which further broadens the potential in manipulating photons and electrons. In particular, its moderate energy bandgap renders BP a new type of nonlinear optical material with operation range from the visible toward the IR and even the mid-IR [19], and it has already been successfully developed for optical saturable absorbers. In the past year, there have emerged exciting demonstrations of BP-based devices, including transistors [9,10], photovoltaics [20,21], photodetectors [22–24], and an optical absorber for ultrafast photonics [25–27].
However, BP suffers from easy degradation because of surface reaction with oxygen and water vapor, resulting in the formation of oxidized BP (OBP), which might further introduce defects and change its electronic band structure [28]. Without external protection, for example, the encapsulation with polymers or other layered materials, e.g., graphene or boron nitride, few-layer BP might easily encounter oxidation. Being exposed in air, the degradation occurs with bubbles that consume BP nanosheets produced by the liquid exfoliation method [29]. Because of the existence of water and oxygen absorption over several days, BP flakes can increase more than 200% in volume and form into [30,31]. The strong affinity between BP and water can modify the performance of a fabricated BP device if under ambient conditions [31]. Otherwise, photons can promote the oxidation reaction between BP and oxygen dissolved in water [15]. Laser-induced chemical modification can largely modify its electronics property and the corresponding photoluminescence spectra, indicating that its optoelectronic property has been under obvious changes [32]. Consequently, it turns out to be an important and fundamental question in understanding the difference of how light nonlinearly interacts with BP and OBP, because such a difference may play a central role in determining the concrete performance of BP-based opto-electronic devices.
Sign up for Photonics Research TOC. Get the latest issue of Photonics Research delivered right to you!Sign up now
In this contribution, we have experimentally investigated the nonlinear optical response in layered OBP nanosheets prepared in water by the liquid-phase exfoliation technique. OA and CA Z-scan measurements were employed to study the nonlinear absorption and nonlinear refraction of OBP dispersion, respectively. OBP dispersions not only exhibit strong ultrafast saturable absorption, but an obvious nonlinear self-defocusing effect at an excitation wavelength of 800 nm. In addition, the third-order optical nonlinearities of OBP dispersions in different concentrations are investigated. In spite of being oxidized, OBP nanoflakes could still be developed for an efficient optical saturable absorber that could lead to the generation of ultrashort pulses at the L-band. The versatile ultrafast nonlinear properties imply a huge potential of layered OBP in the development of nanophotonics devices, such as mode lockers, optical switches, and wavelength converters.
2. Experimental
A. Synthesis and Characterization of OBP Nanoplatelets
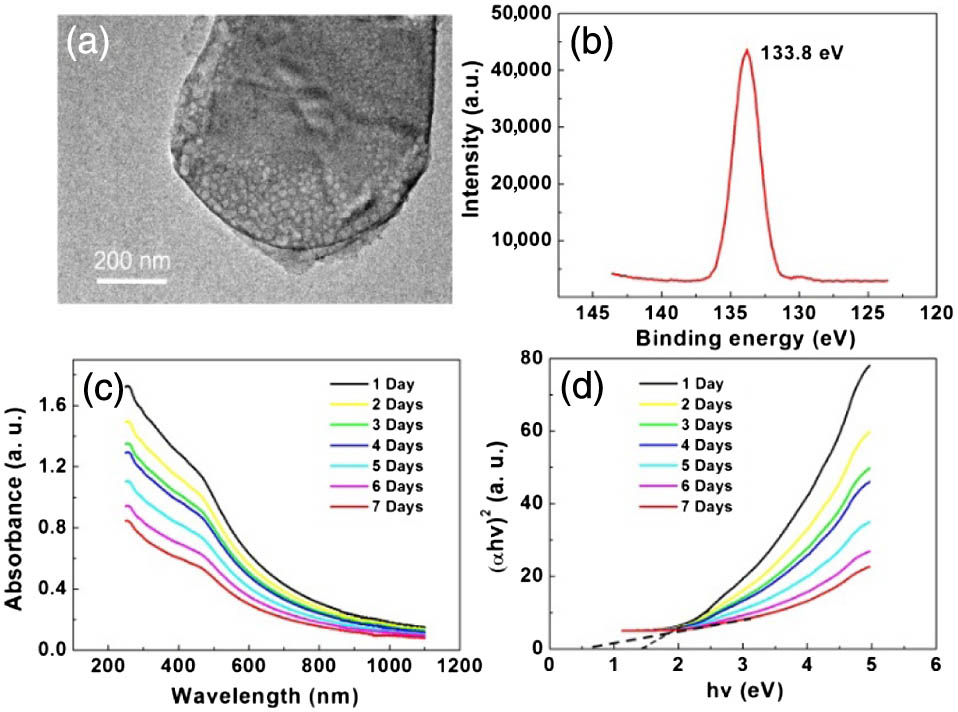
OBP nanosheets are prepared in water by a simple liquid exfoliation technique. Briefly, a chunk of bulk BP crystal () was ground into powder and immersed into aqueous solution. The solution was tip ultrasonicated in an ice bath for 3 h. After ultrasonication, the dispersions were allowed to settle more than 24 h, and the resulting stable OBP dispersions were obtained by centrifugation at 3000 rpm for 20 min. We then performed transmission electron microscopy (TEM) characterization of the OBP nanoflakes in order to study their morphology and degree of oxidation. Figure 1(a) shows a typical TEM image of an OBP nanoflake on a lacy carbon support. The flakes have some bubbles and look blurred out at the surface; we note that changes in the apparent morphology may be related to oxidation damage. This is further confirmed by x-ray photoelectron spectroscopy (XPS) analysis, by which the chemical composition of the OBP is determined after the sample has been sputtered for 5 min to get rid of surface contamination [see Fig. 1(b)]. The spectra show that the and doublets at 129.3 and 130.2 eV, respectively, are weak, characteristic of crystalline BP. In addition, strong oxidized phosphorus (i.e., ) sub-bands are apparent at 133.8 eV, which has been observed in previous measurements. These results suggest that OBP is successfully obtained under water by the liquid exfoliation technique.
Figure 1.Characterization of OBP. (a) TEM image and (b) XPS spectra of OBP. (c) Optical absorbance of an OBP nanosheet from 1 day to 7 days. (d) Representative direct Tauc plots used to determine the band-to-band transition from 1 day to 7 days.
It might appear that the oxidization process is time relevant for liquid exfoliated BP. This makes it important to monitor the temporal stability of liquid-dispersed BP. To do this, we have tracked the corresponding optical absorbance spectra of the suspensions at different times [Fig. 1(c)]. We note that the oxidation of BP significantly increases in measured absorbance over time. We sought to quantify these absorption features by using Tauc analysis, which had been performed in [33]. The Tauc model is expressed as , where is the absorption coefficient, is the photon energy, represents the nature of the transition, and is the bandgap. The plots achieved an excellent fit to a Tauc model when , indicating that the bandgap transition of 2D phosphorus is direct and allowed [Fig. 1(d)]. The fact is that the Tauc models fit our data may suggest that the low-energy transition energy values of 1.47 eV in 1 day and 0.65 eV in 7 days and later, which a suspension containing the higher degree of oxidation.
B. Z-Scan Measurements
Using the standard Z-scan measurement technique, we are able to distinguish the contributions from the real and imaginary parts of complex third-order optical nonlinearity of OBP nanosheet dispersions. The experimental setup has been previously reported by several different research groups [34–36], while the system has been adapted to the dispersion samples. The OBP dispersion was placed inside a 1 mm cuvette and subjected to femtosecond pulses emitted from a Coherent femtosecond laser with a central wavelength at 800 nm, a 3 dB spectral width of 15 nm, a pulse width of 100 fs, and a repetition rate of 1 kHz. These laser pulses were further attenuated by a neutral density filter, from which the average power of the incident laser pulses can be adjusted freely. The laser beam is then focused by a 500 mm lens, and the focus radius is about 30 μm by calibrating it with and ZnSe. The few-layer OBP solution contained within the 1 mm cuvette was perpendicularly placed to the beam axis and translated along the beam axis by a motorized linear stage. The Z-scan measurement results were collected by two identical photodetectors controlled through a computerized dual-channel powermeter.
Concerning the real and imaginary parts of third-order optical nonlinearity, the measurements can be divided into two parts, open-aperture (OA) measurement and closed-aperture (CA) measurement. The OA measurement involves the collection of the entire optical transmittance of a sample with respect to the change of the incident intensity, which represents the nonlinear absorption of the sample, while in the CA measurement regime, only a portion of the transmitted power is picked off through the aperture, and both nonlinear absorption and nonlinear refraction are combined in the CA trace. Therefore, a typical CA curve may not indicate significant difference if compared with the corresponding OA curve because the contribution of nonlinear absorption (for example, saturable absorption) is of the same order of magnitude as that of the nonlinear phase. However, the division of the CA trace by the OA trace can lead to the extraction of the pure nonlinear refractive index and nonlinear absorption.
3. RESULTS AND DISCUSSION
A. Saturable Absorption of OBP
To identify the power-dependent nonlinear absorption of the OBP solution, OA measurements were performed at different intensities, as shown in Fig. 2. At an excitation power of 1 mW, corresponding to an on-focal intensity of about , a typical saturable absorption curve was obtained, as shown in Fig. 2(a). That is, with the approaching of the OBP sample with respect to the focus point, the incident laser peak intensity can correspondingly increase and the optical transmittance can increase as well because of the saturable absorption effect. With higher excitation intensities, a similar nonlinear absorption effect could be observed while the normalized transmittance became higher at the focus point for stronger laser illumination. This suggests that the saturable absorption effect dominates over other effects, such as optical limiting. The OBP nanosheets attenuated the transmittance of the low-intensity pulse while allowing the transmittance of the high-intensity pulse. This nonlinear phenomenon has been previously reported in the case of BP nanoplatelets. The SA response in OBP could be used in ultrafast photonics, such as for saturable absorbers, and switches.
Figure 2.(a) Z-scan measurements of the OBP nanosheet dispersions at different intensities at the 800 nm band. (b) Relation between the incident intensity and normalized transmittance of the OBP sample.
According to the nonlinear absorption theory, the absorption coefficient consists of the linear absorption coefficient and the nonlinear absorption coefficient :
In the experiments, the originates from the OBP nanosheets and can be extracted from the experimental data in Fig. 2(a) by fitting with the following model: where is the normalized transmittance, is on-focus intensity, is the position of the sample with respect to the focal position, is the Rayleigh range, is the effective length, and is the length of the sample. For experiments in Fig. 2, the linear transmittance is about 32.3% and the fitted value of is about . In addition, the imaginary part of the third-order nonlinearity is related to and is expressed as . Here, is the speed of light, is the wavelength of the incident light, and is the linear refractive index. The figure of merit (FOM) is defined as , where for the sample in Fig. 2. Therefore, and FOM of the OBP in the water is calculated as and , respectively. The value of the FOM for OBP is comparable with some other SA nanomaterials, such as graphene () [37], graphene oxide () [37], and () [38]. It can be deduced that OBP has a large SA response, which suggests that this material might have potential applications for ultrashort pulse generation.
Concerning the case of nanomaterials with SA response, which could be described as a simple two-level model, Z-scan measurement data can be analyzed with following equation: where and are the normalized nonlinear transmittance and linear transmittance of the sample, respectively; is the incident intensity and is the saturable intensity; and is the saturable absorption component while is the nonsaturable absorption components. The experimental data has a good fit with the above model, which gives a saturable intensity of .
The nonlinear absorption property is closely related to the band structure in semiconductors. To analyze the saturable absorption of OBP, we used the first principles calculation to explore the band structure of bare monolayer phosphorene and OBPs, as shown in Fig. 3. Figure 3(a) exhibits the direct band structure of the bare monolayer phosphorene, and the bandgap is about 0.913 eV, which is between those of monolayer phosphorene and bulk phosphorus. Because BP has many different types of oxides, here we calculated three band structures of nonstoichiometric OBP, i.e., , , and . The direct band structure is maintained in all three OBPs, which indicates that OBP could have large nonlinear absorption. Otherwise, the bandgap of , , and were calculated to be 1.178, 1.206, and 0.536 eV, respectively. The calculated results are basically in accordance with the Tauc model fitting above. The energy of photons (1.55 eV) at 800 nm is larger than the calculated bandgaps of the three OBPs, so one electron in the valence band can be easily stimulated to the conduction band with one single photon, which is described as the one photon saturable absorption model above. Furthermore, we can deduce from the calculated results that the oxidation can tune the band structure of BP, which means it can generate different nonlinear absorption for different nonlinear applications.
Figure 3.Band structure of (a) bare monolayer phosphorene, (b) , (c) , and (d) .
The nonlinear refractive index of the OBP sample was measured with the CA Z-scan technique, as shown in Fig. 4. The OA measurement in Fig. 4(a) exhibits an obvious SA response, as discussed in the above section. Because the nonlinear phase shift is of the same magnitude as the effect of saturable absorption, the CA measurement in Fig. 4(b) failed to show a typical peak and valley curve. After dividing the CA curve by the OA curve, the typical shape of the nonlinear refractive index appeared as in Fig. 4(c). Furthermore, the up and down curve implies a small negative phase shift , indicating that OBP dispersion shows a self-defocusing effect.
Figure 4.Z-scan measurements of OBP dispersions and pure water in a cuvette. (a) OA, (b) CA, and (c) CA/OA measurements of OBP nanosheet dispersions; (d) OA and CA measurements of pure water in the cuvette.
We fit the experimental data with the following function: where is the normalized transmittance, and is the on-axis nonlinear phase shift at the focus, is the wavelength number, is the peak intensity at the focus. The inferred nonlinear phase change is about . However, the measured nonlinear refractive index contains that of the quartz cuvette. To get a more accurate value of in OBP dispersion, we measured the pure water in quartz cuvette, and found that the cuvette has a small positive nonlinear phase shift [Fig. 4(d)].
Hence, the nonlinear phase shift caused by the OBP dispersion should be fixed as , and the nonlinear refractive of OBP dispersions is about . The corresponding real part of third-order susceptibility is calculated to be .
Here, in order to generally determine the nonlinear refractive index of OBP nanosheets, we calculate the effective length of the sample. Assuming the absorption of monolayer OBP is the same as that of monolayer BP () [32], we therefore estimate that the total number of layers can be by the model of , where and are the transmittance of the OBP dispersion and pure water in the cuvette, respectively, and is the number of layers. From the previous investigation, the oxidation process could largely change the thickness and volume of OBP as compared to BP. So, we set the thickness of monolayer OBP as 1.62 nm, which is 200% of that of monolayer BP. Therefore, the effective length of the OBP nanosheets can be estimated to be . The effective nonlinear refractive index of the OBP is then calculated to be , and the real part of the third-order susceptibility is corresponding to be .
Furthermore, we studied the nonlinear absorption and refractive index of OBP nanosheet dispersions at different concentrations. Starting from the original OBP dispersion solution with an optical transmittance of 32.3%, OBP nanosheet dispersions with different concentrations were obtained after by centrifugation at 3000 and 6000 rpm through a centrifuge, and they showed a linear transmission of 44.3% and 87.4%, respectively. By performing the corresponding Z-scan measurements, the nonlinear optical absorption and refraction were well characterized, as shown in Table 1. One can clearly find that all three samples show obvious SA and a self-defocusing effect at different intensities. These systematic studies could well verify the accuracy of our studies. The related linear and nonlinear parameters are summarized in Table 1. All the OBP dispersion flakes not only have very high nonlinear absorption, similar to that of BP dispersion reported in recent work [34], but they also show significant self-defocusing effects. Because of the different concentrations, the OBP nanosheets in water have different nonlinear parameters. The third-order susceptibility and FOM increased with concentration, suggesting that we can tune the nonlinear property by adjusting the concentration of the material for specific applications in ultrafast photonics.
T(%)
α0(cm−1)
Leff(mm)
αNL(cm/GW,×10−2)
Is(GW/cm2)
Imχ(3)(esu,×10−14)
FOM (esucm,×10−15)
n2(cm2/W,×10−16)
Reχ(3)(esu,×10−14)
32.3
11.3
0.60
−(6.82±0.12)
773±37
−(9.92±0.16)
−(8.81±0.15)
−(3.61±0.19)
−(5.27±0.27)
44.3
8.14
0.68
−(3.80±0.20)
571±10
−(5.54±0.29)
−(6.81±0.36)
−(2.56±0.14)
−(3.74±0.20)
87.4
1.35
0.93
−(0.34±0.02)
148±2
−(0.49±0.03)
−(3.67±0.21)
−(0.98±0.05)
−(1.43±0.07)
Table 1. Linear and Nonlinear Parameters of the OBP Dispersions Excited at the Femtosecond Region
Because of the volume increase caused by oxidation, the OBP can gather much more heat than BP nanosheets under femtosecond excitation. As we know, the accumulation of heat can lead to the thermal lensing effect, which could cause nonlinear defocusing in OBP dispersions. The higher the concentration in OBP dispersions, the more thermal lensing effect would occur in the samples. Thus, should increase with the concentration of OBP dispersions, which is in accordance with results summarized in Table 1. So, we deduced that the nonlinear focusing in OBP may be caused by the thermal lensing effect.
C. Ultrafast Photonics Application
The optical saturable absorption of OBP for the passive mode locking of fiber lasers was also investigated. The ring laser with a microfiber-based SA is shown in Fig. 5(a). We use a laser diode at 1480 nm wavelength as the pump laser. In the fiber laser, a reflection-type wavelength division multiplexer (WDM) was employed to avoid the influence of the residual pump. Two polarization controllers (PCs) were used to optimize the mode-locking state. To ensure a unidirectional light propagator, a polarization-independent isolator (PI-ISO) was employed. 5% of the intracavity optical power was tapped via an output coupler (OC), which is made of dispersion-shifted fiber (DSF). The laser output is monitored by an optical spectrum analyzer (Yokogawa AQ6370C), a 1 GHz oscilloscope (Agilent DSO9104A), and a 1.2 GHz detector (Thorlabs DET01CFC). The pulse width is measured by an optical autocorrelation (Femtochrome FR-103HS), and the pulse repetition rate is measured by a spectrum analyzer (Agilent, N9030A). The total cavity length is 18.3 m, includes a 2 m erbium-doped fiber (EDF, LIEKKI 110-4/125), 15 m of standard single-mode fiber (SMF), and 1.24 m of DSF.
Figure 5.(a) Experimental setup of the OBP-SA based EDF laser. (b) Pulse spectra, (c) pulse train, (d) autocorrelation trace, and (e) RF spectrum of the output laser pulses.
In this experiment, we used a fiber tapered down to about 10 μm. First, the fiber laser operation while incorporating the microfiber without an OBP solution deposited was shown to be continuous wave, even though the pump power and cavity polarization were widely changed. There was no saturable absorption effect in the cavity. Then we fabricated a microfiber-based OBP photonic device by the optical deposition technique. OBP solution was injected onto the silica tube that ringed the microfiber. We stopped the ASE light injection about 20 min after the deposit started. With the OBP-deposited microfiber, stable soliton pulses were easily obtained by setting an appropriate orientation of the paddles of the PC. Figures 5(b)–5(e) show the measured performance of the fabricated mode-locked fiber laser with microfiber-based OBP SA at the anomalous dispersion regime. Ultrashort pulses with characteristic sideband structures were generated, as shown in Fig. 5(b), which clearly suggests that the fiber laser is operated in the self-starting mode-locking regime. The central wavelength is about 1571.5 nm, and the 3 dB bandwidth is 4.15 nm. The time trace of the oscilloscope is shown in Fig. 5(c) with a pulse repetition rate of 11 MHz, corresponding to the total cavity length. Figure 5(d) shows the corresponding intensity autocorrelation of the soliton. Pulse duration is measured to be 727 fs when a pulse profile is assumed. The time–bandwidth product of the output pulse is 0.366 at a pump power of 289 mW. The self-starting threshold pump power is about 145 mW. Figure 5(e) depicts the radio-frequency (RF) spectra of the pulse train when the pump power is 289 mW. The signal-to-noise ratio is more than 60 dB, which suggests the mode locking is stable.
4. CONCLUSION
In conclusion, we have fabricated oxidized few-layer BP with different concentrations by using the liquid phase exfoliation technique, and further experimentally confirmed the nonlinear absorption coefficient and nonlinear refractive index of OBP nanosheets through the femtosecond Z-scan measurement method. It has been found that OBP nanosheet dispersions can show strong SA responses, similar to that of BP nanosheets, and the self-defocusing effect. Thethird-order nonlinear optical susceptibility was experimentally measured for different OBP nanosheet dispersions (, ). The self-defocusing effect was first found in the OBP dispersion, the nonlinear refractive index of OBP nanosheets was calculated to be , and . All the nonlinear properties in OBP dispersions increase with the concentration of OBP nanosheets.
Interestingly, according to these experiments, we did not observe self-defocusing in pure BP nanosheets, which suggests that oxidation-induced defects or changes in electronic band structure may play a central role in altering the nonlinear optical response in BP. Our experimental findings provide direct evidence in tailoring the optical properties of BP through oxidation. The experimental results indicate that OBP nanosheets not only have properties similar to those of BP nanosheets as a passive mode-locking device in an ultrafast laser, but that, even more importantly, OPB shows potential for Kerr-effect-based applications in ultrafast regions, such as all-optical processing.
[11] F. Xia, H. Wang, Y. Jia. Rediscovering black phosphorus as an anisotropic layered material for optoelectronics and electronics. Nat. Commun., 5, 4458(2014).