• Journal of Geo-information Science
  • Vol. 22, Issue 3, 580 (2020)
Xinli KE*, Bangyong XIAO, Weiwei ZHENG, Yanchun MA, and Hongyan LI
Author Affiliations
  • College of Public Administration, Huazhong Agricultural University, Wuhan 430070, China
  • show less
    DOI: 10.12082/dqxxkx.2020.190404 Cite this Article
    Xinli KE, Bangyong XIAO, Weiwei ZHENG, Yanchun MA, Hongyan LI. Urban-agricultural-ecological Space Zoning based on Scenario Simulation[J]. Journal of Geo-information Science, 2020, 22(3): 580 Copy Citation Text show less
    The location of Wuhan
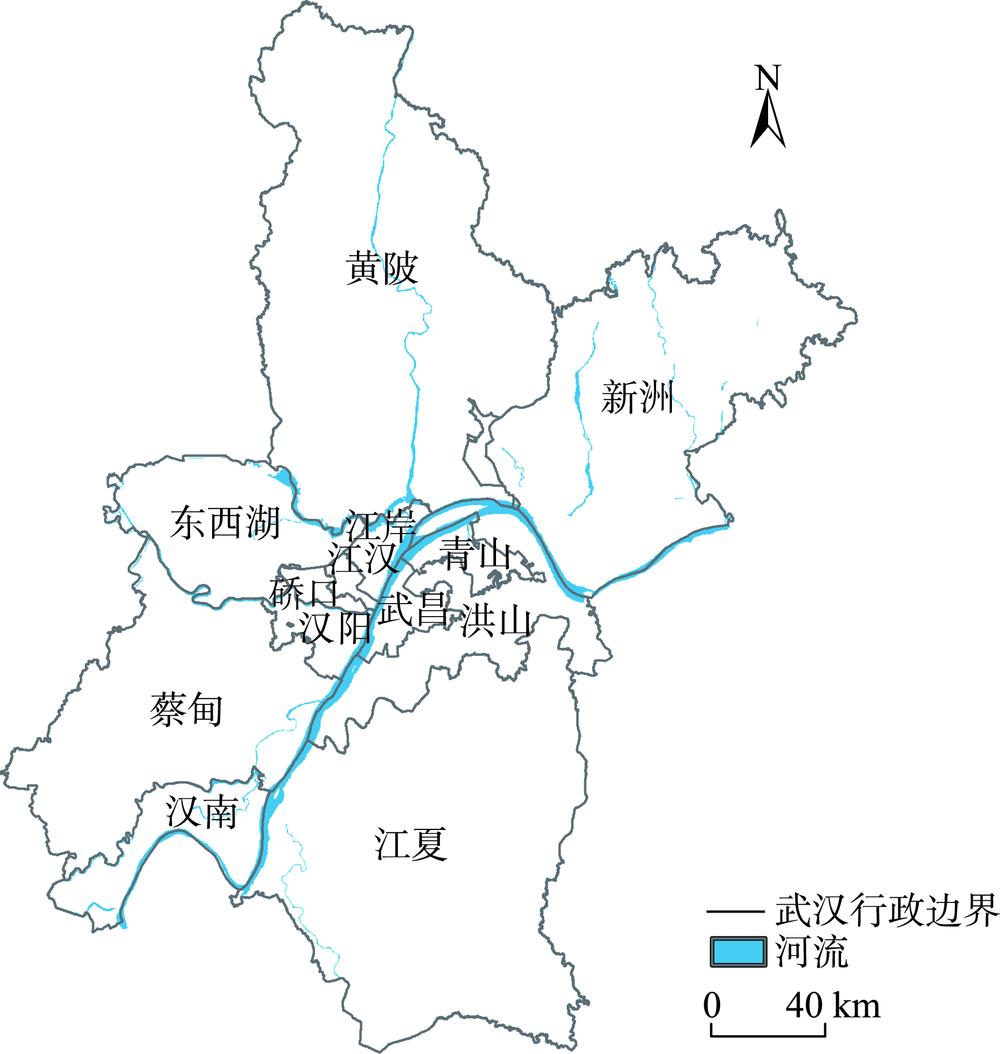
    Fig. 1. The location of Wuhan
    Research scheme of Wuhan city under different scenarios
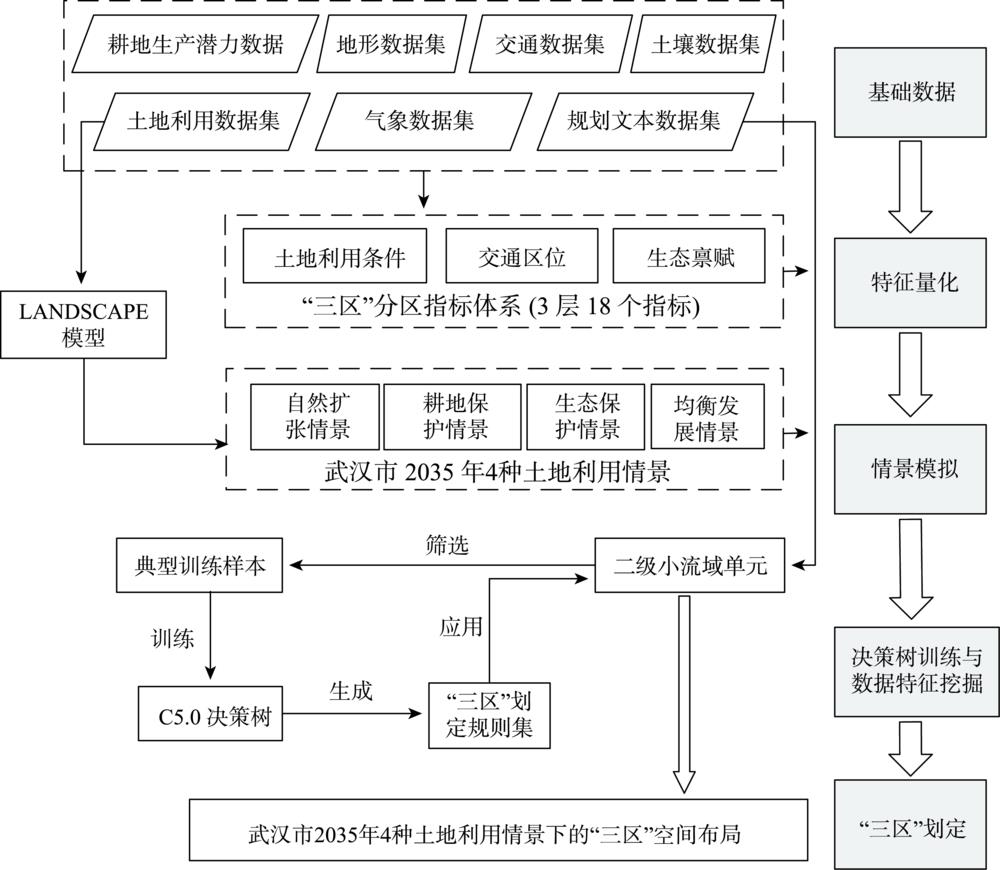
    Fig. 2. Research scheme of Wuhan city under different scenarios
    Spatial distribution of adjusted resistance values under different scenarios
    Fig. 3. Spatial distribution of adjusted resistance values under different scenarios
    The spatial distribution of the urban- agricultural-ecological space under four scenarios of Wuhan
    Fig. 4. The spatial distribution of the urban- agricultural-ecological space under four scenarios of Wuhan
    Comparisons of urban-agricultural-ecological spatial distribution under each two scenarios in Wuhan City
    Fig. 5. Comparisons of urban-agricultural-ecological spatial distribution under each two scenarios in Wuhan City
    数据类型数据内容数据来源数据描述
    土地利用数据集武汉市2010年土地利用现状中国科学院资源环境数据中心空间分辨率为30 m×30 m,根据研究需要将二级地类合并8大一级地类
    武汉市2015年土地利用现状(http://www.resdc.cn/)
    气象数据集武汉市2015年年降雨量中国科学院资源环境数据中心数据原始空间分辨率为1 km×1 km,年降雨量单位为0.1 mm,年均气温单位为0.1 ℃
    武汉市2015年年均气温(http://www.resdc.cn/)
    耕地生产潜力数据集武汉市2010年耕地生产潜力数据中国科学院资源环境数据中心(http://www.resdc.cn/)采用GAEZ模型测算所得,初始分辨率为1 km×1 km
    地形数据集武汉市高程数据美国航空航天局航空雷达测绘数据(SRTM)(https://www.nasa.gov/)数据原始分辨率为90 m×90 m
    武汉市坡度数据
    土壤数据集土壤有机质含量中国土壤数据库(http://vdb3.soil.csdb.cn/)采用克里金插值法获得研究区域不同空间位置的土壤特征
    土壤有效磷含量
    土壤耕作层厚度
    交通数据集武汉市省道运用Python语言编写API接口,从百度地图获得初始数据为矢量数据,采用克里金插值法反映研究区不同空间位置的交通区位特征
    武汉市高速公路
    武汉市国道
    武汉市铁路
    武汉市市区道路
    规划等文本数据集《TDT 1024-2010 市(地)级土地利用总体规划编制规程》中华人民共和国自然资源部(http://www.mnr.gov.cn/)用于了解不同国土主体空间类型之间的性质差异与用途管制规则差异
    《TDT 1024-2010 县级土地利用总体规划编制规程》
    《生态文明体制改革总体方案》武汉市自然资源和规划局(http://gtghj.wuhan.gov.cn/)用于了解不同主导功能区域的规划边界及划定原则
    《武汉市全域生态框架保护规划》
    《武汉市土地利用总体规划(2006—2020年)》
    《武汉市工业发展“十三五”规划》武汉市人民政府(http://www.wuhan.gov.cn)
    《2016年城乡建设统计年鉴》中华人民共和国住房和城乡建设部(http://www.mohurd.gov.cn/)用于预测武汉市2035年城镇建设用地面积
    Table 1. Data sources and descriptions
    因素层指标层指标计算方法指标描述
    交通区位到省道的距离/m运用ArcGIS 10.2平台的欧氏距离工具进行提取反映城镇发展条件
    到高速公路的距离/m
    到市区道路的距离/m
    到国道的距离/m
    城镇建设用地比重/%城镇建设用地面积/研究单元面积
    农村建设用地比重/%农村建设用地面积/研究单元面积
    生态禀赋年均降雨量/mm研究单元内年均降雨量均值反映生态资源基底特征
    年均气温/℃研究单元内年均气温均值
    水系比重/%(河流面积+湿地面积)/研究单元面积
    森林比重/%林地面积/研究单元面积
    草地比重/%草地面积/研究单元面积
    到最近水系的距离/m运用ArcGIS 10.2平台的欧氏距离工具进行计算得到
    土地利用条件高程/m源自美国航空航天局航空雷达测绘数据(SRTM)反映土地生产条件
    坡度/°运用ArcGIS 10.2平台的坡度提取工具,由DEM获得
    土壤有机质含量/(g/kg)源自中国土壤数据库
    土壤有效磷含量/(mg/kg)
    土壤耕作层厚度/(cm)
    耕地比重/%耕地面积/研究单元面积
    Table 2. The indicator system of urban-agricultural-ecological space zoning
    情景类别阻抗类型耕地林地草地河流湿地城镇建设用地农村建设用地
    初始阻抗1.351.401.201.501.451.501.30
    自然扩张调整阻抗
    耕地保护调整阻抗图3(a)
    生态保护调整阻抗图3(b)图3(b)图3(b)图3(b)
    均衡发展调整阻抗图3(c)图3(c)图3(c)图3(c)图3(c)
    Table 3. Resistance values of different land use types under four land use scenarios
    地类耕地林地草地河流湿地城镇建设用地农村建设用地未利用地
    Kappa simulation0.1760.1100.0081.0000.0940.2740.0720.070
    KTransLoc0.3280.2280.2491.0000.1780.3210.1690.242
    KTransition0.5370.4830.3221.0000.5310.8530.4280.287
    Table 4. The accuracy verification of LANDSCAPE model
    土地利用情景耕地林地草地河流湖泊城镇建设用地农村建设用地未利用地
    耕地保护4518.45692.1255.23299.101160.201460.22252.8162.53
    变化量111.49-43.35-13.500-62.1606.540.98
    生态保护4341.11748.8072.46299.101263.501460.22251.1664.38
    变化量-65.8513.333.73041.0704.892.83
    均衡发展4412.56726.0364.67299.101221.801460.22251.6964.63
    变化量5.60-9.44-4.060-0.6005.423.08
    自然扩张4406.96735.4768.73299.101222.41460.22246.2761.55
    Table 5. Land use structure and comparative analysis between each scenario and the Natural development scenario of Wuhan (km2)
    情景类型生态空间农业空间城镇空间
    耕地保护/km24273.241725.392575.56
    空间占比/%49.8420.1230.04
    生态保护/km24395.901723.092455.20
    空间占比/%51.2720.1028.63
    均衡发展/km24162.151725.222686.82
    空间占比/%48.5420.1231.34
    自然扩张/km24213.351723.552637.28
    空间占比/%49.1420.1030.76
    Table 6. The area and proportion of the urban-agricultural-ecological space under four scenarios of Wuhan
    Xinli KE, Bangyong XIAO, Weiwei ZHENG, Yanchun MA, Hongyan LI. Urban-agricultural-ecological Space Zoning based on Scenario Simulation[J]. Journal of Geo-information Science, 2020, 22(3): 580
    Download Citation