Author Affiliations
1College of Geomatics, Shandong University of Science and Technology, Qingdao 266590, China1山东科技大学测绘科学与工程学院,青岛 2665902State Key Laboratory of Resources and Environmental Information System, Institute of Geographic Sciences and Natural Resources Research, Chinese Academy of Sciences, Beijing 100101, China2中国科学院地理科学与资源研究所 资源与环境信息系统国家重点实验室,北京 1001013China University of Petroleum, Qingdao 266580, China3中国石油大学(华东),青岛 266580show less
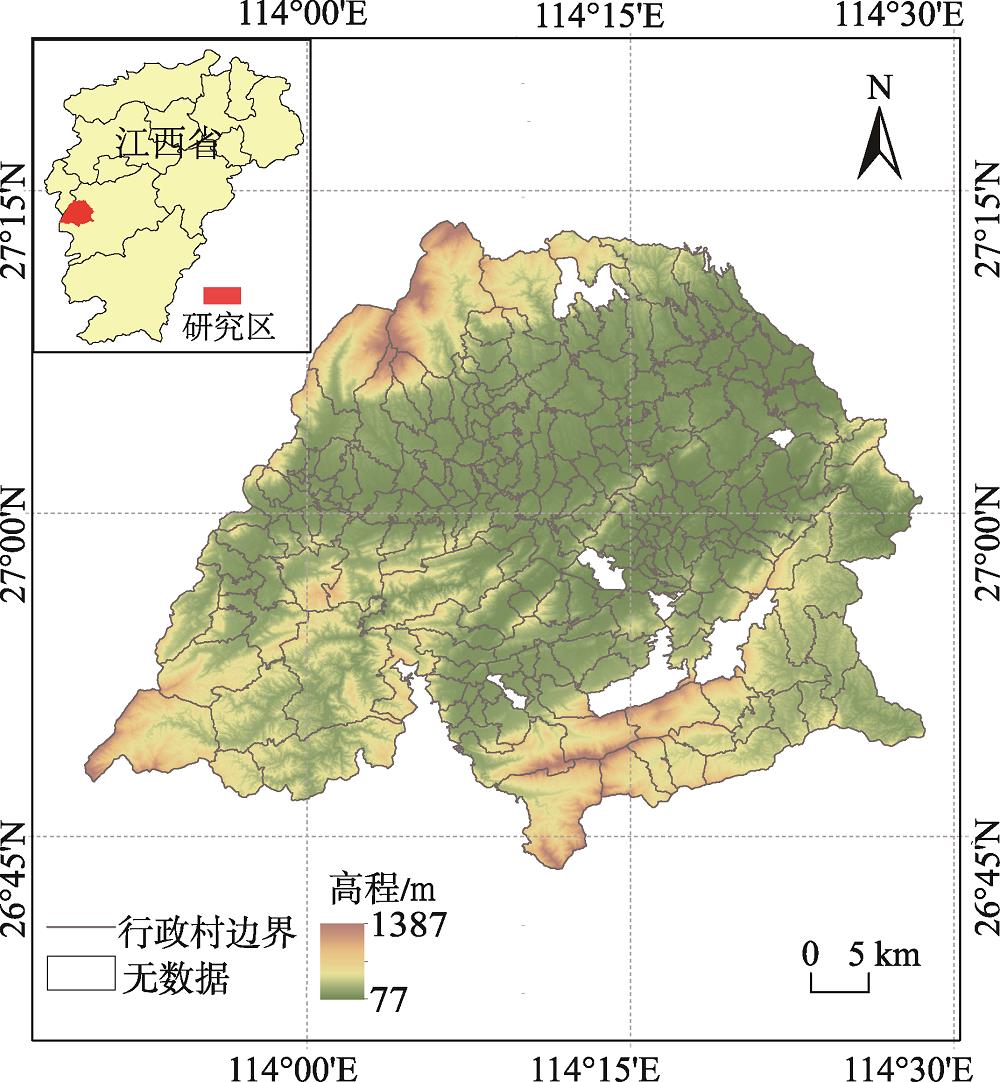
Fig. 1. Location and elevationdistribution of Yongxin County in Jiangxi province
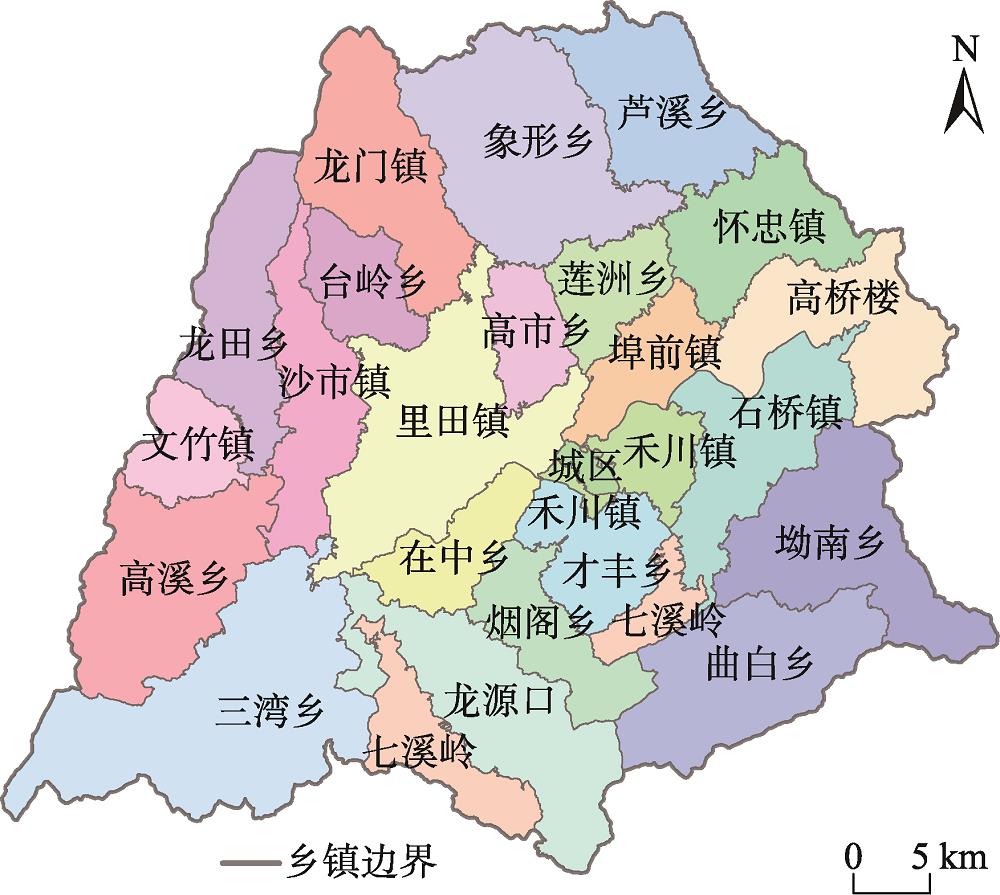
Fig. 2. Distribution of towns in Yongxin County
Fig. 3. Distribution of regression coefficients of the PCA-GWR model
Fig. 4. The poverty incidence in Yongxin County from 2013 to 2017
Fig. 5. Spatial distribution pattern of poverty incidence at village level in Yongxin County from 2013 to 2017
Fig. 6. Global Moran's I scatter map of poverty incidence at village level in Yongxin County
Fig. 7. Results of local spatial autocorrelation of poverty incidence at village level in Yongxin county from 2013 to 2017
贫困维度 | 贫困指标 | Pearson相关系数 | 相关性程度 |
---|
自然因素 | 高程 | 0.289** | 显著弱相关 | NDVI | 0.282** | 显著弱相关 | 坡度 | 0.031 | 不显著 | 坡度>8°面积占比 | 0.214** | 显著弱相关 | 社会因素 | 疾病 | 0.711** | 显著强相关 | 到最近镇驻地距离 | -0.083 | 不显著 | 缺乏劳动力 | 0.887** | 显著极强相关 | 夜间灯光 | -0.173** | 显著极弱相关 | 低学历 | 0.986** | 显著极强相关 | 经济因素 | 人均收入 | 0.107 | 不显著 |
|
Table 1. Analysis of the correlation between poverty indicators and poverty incidence in Yongxin County in 2013
| 疾病 | 缺乏劳动力 | 低学历 | 坡度>8°面积占比 | 高程 | NDVI |
---|
疾病 | 1.000 | 0.786** | 0.737** | 0.149* | 0.164* | 0.159* | 缺乏劳动力 | 0.786** | 1.000 | 0.912** | 0.229** | 0.291** | 0.297** | 低学历 | 0.737** | 0.912** | 1.000 | 0.194** | 0.268** | 0.281** | 坡度>8°面积占比 | 0.149* | 0.229** | 0.194** | 1.000 | 0.686** | 0.397** | 高程 | 0.164* | 0.291** | 0.268** | 0.686** | 1.000 | 0.689** | NDVI | 0.159* | 0.297* | 0.281* | 0.397** | 0.689** | 1.000 |
|
Table 2. Correlation analysis of poverty indicatorsin Yongxin County in 2013
主成分 | 特征值 | 贡献率% | 累计贡献率% |
---|
第一主成分 | 3.127 | 52.124 | 52.124 | 第二主成分 | 1.701 | 28.352 | 80.476 | 第三主成分 | 0.605 | 10.088 | 90.564 | 第四主成分 | 0.278 | 4.634 | 95.198 | 第五主成分 | 0.206 | 3.428 | 98.626 | 第六主成分 | 0.082 | 1.374 | 100 |
|
Table 3. Principal component analysis of poverty indicatorsin Yongxin County in 2013
原始变量 | 第一主成分 | 第二主成分 | 第三主成分 |
---|
疾病 | 0.619 | -0.005 | 0.094 | 缺乏劳动力 | 0.534 | 0.127 | 0.139 | 低学历 | 0.525 | 0.128 | 0.091 | 坡度>8°面积占比 | 0.055 | 0.136 | 1.232 | 高程 | 0.070 | 0.504 | 0.843 | NDVI | 0.078 | 0.728 | 0.235 |
|
Table 4. Eigenvectors of each principal componentin Yongxin County in 2013
VIF统计 | 低学历 | 疾病 | 缺乏劳动力 | 高程 | NDVI | 坡度>8°面积占比 |
---|
VIF均值 | 4.94 | 2.53 | 6.05 | 3.16 | 2.02 | 2.01 | VIF最大值 | 7.32 | 3.64 | 8.69 | 3.86 | 2.30 | 2.55 | VIF最小值 | 3.66 | 2.08 | 4.51 | 2.58 | 1.78 | 1.55 |
|
Table 5. Local VIF statistics of poverty indicators of the GWR model
VIF统计 | 第一主成分 | 第二主成分 | 第三主成分 |
---|
VIF均值 | 1.02 | 1.03 | 1.03 | VIF最大值 | 1.06 | 1.15 | 1.19 | VIF最小值 | 1.00 | 1.00 | 1.00 |
|
Table 6. Local VIF statistics of the principal components of the PCA-GWR model
年份 | Moran's I | z值 | p值 |
---|
2013 | 0.343 | 8.878 | 0.001 | 2014 | 0.288 | 7.487 | 0.001 | 2015 | 0.347 | 8.737 | 0.001 | 2016 | 0.248 | 6.269 | 0.001 | 2017 | -0.014 | 0.392 | -0.308 |
|
Table 7. Global autocorrelation results of the poverty incidence at village level in Yongxin County
年份 | 热点个数 | 冷点个数 | 不显著个数 |
---|
2013 | 16 | 31 | 185 | 2014 | 19 | 33 | 180 | 2015 | 23 | 36 | 173 | 2016 | 28 | 26 | 178 | 2017 | 22 | 11 | 199 |
|
Table 8. Number of cold and hot spots of poverty incidence at village level in Yongxin county from 2013 to 2017