• Acta Photonica Sinica
  • Vol. 51, Issue 6, 0606002 (2022)
Yan ZHANG1, Song GAO1, Yaohui XUE2, Zhuo ZHANG2, Xiaozhang WANG2, Shanshan CAO3, Haitao XU3, Shengfei SHE1, Jin XIE1, Yizhao LI1, Lutao LIU1, Haitao GUO1, and Chaoqi HOU1、*
Author Affiliations
  • 1Research Center of Special Optical Fiber and Device,Xi'an Institute of Optics and Precision Mechanics,Chinese Academy of Sciences,Xi'an 710119,China
  • 2China North Industries Group Corporation Norinco Group,Xi'an Modern Control Technology Research Institute,Xi'an 710119,China
  • 3Jiangsu Zhong Tian Technology Co.,Ltd.,Nantong,Jiangsu 226000,China
  • show less
    DOI: 10.3788/gzxb20225106.0606002 Cite this Article
    Yan ZHANG, Song GAO, Yaohui XUE, Zhuo ZHANG, Xiaozhang WANG, Shanshan CAO, Haitao XU, Shengfei SHE, Jin XIE, Yizhao LI, Lutao LIU, Haitao GUO, Chaoqi HOU. Research on Factors of Affecting the Strength of Silica Optical Fiber and Process Improvement[J]. Acta Photonica Sinica, 2022, 51(6): 0606002 Copy Citation Text show less
    Structure of fiber drawing tower
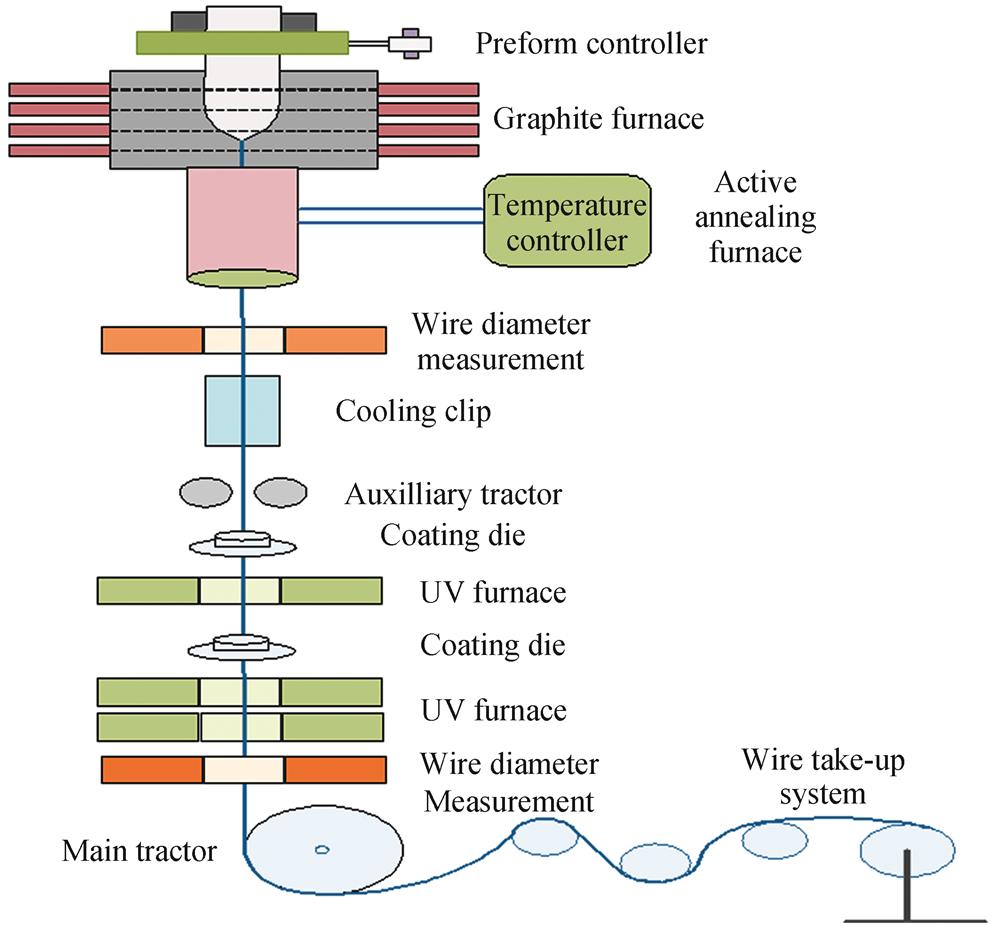
    Fig. 1. Structure of fiber drawing tower
    Distribution of average breaking force of untreated fiber under different drawing speed
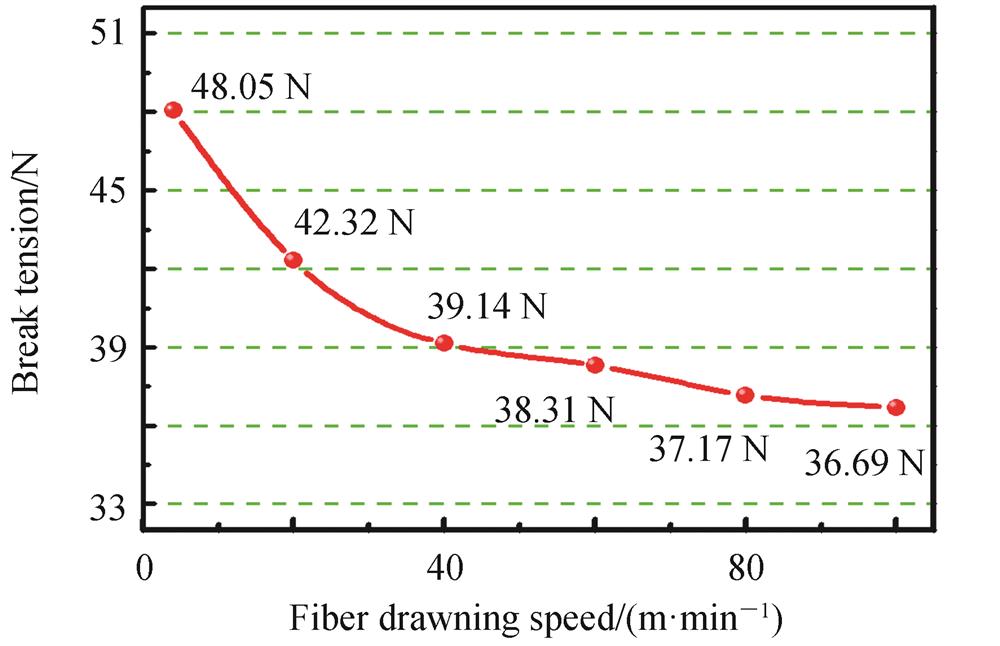
    Fig. 2. Distribution of average breaking force of untreated fiber under different drawing speed
    Microphotographs of the fiber preform
    Fig. 3. Microphotographs of the fiber preform
    The influence of average fiber breaking force under different annealing processes
    Fig. 4. The influence of average fiber breaking force under different annealing processes
    Average breaking force vs. fiber drawing speed under different annealing processes
    Fig. 5. Average breaking force vs. fiber drawing speed under different annealing processes
    Optimization of average breaking force under different fiber drawing speed
    Fig. 6. Optimization of average breaking force under different fiber drawing speed
    SEM image of the fiber under different conditions
    Fig. 7. SEM image of the fiber under different conditions
    Distribution of Weibull under different processes
    Fig. 8. Distribution of Weibull under different processes
    Process conditionsPreform processing conditionsSurface roughnessAverage breaking force/N
    Original preform/6.5236.69
    Process AH2=70 L/min flame velocity 50 mm/min twice5.4345.34
    Process BH2=80 L/min flame velocity 50 mm/min twice4.4145.01
    Process C

    H2=80 L/min flame velocity 50 mm/min once

    H2=80 L/min flame velocity 30 mm/min once

    1.5342.19
    Process D

    H2=80 L/min flame velocity 50 mm/min once

    H2=80 L/min flame velocity 25 mm/min once

    0.8438.25
    Process E

    H2=80 L/min flame velocity 50 mm/min once

    H2=80 L/min flame velocity 25 mm/min twice

    0.0735.69
    Table 1. Average fiber breaking force of different flame polishing processes under 100m/min fiber drawing speed
    Yan ZHANG, Song GAO, Yaohui XUE, Zhuo ZHANG, Xiaozhang WANG, Shanshan CAO, Haitao XU, Shengfei SHE, Jin XIE, Yizhao LI, Lutao LIU, Haitao GUO, Chaoqi HOU. Research on Factors of Affecting the Strength of Silica Optical Fiber and Process Improvement[J]. Acta Photonica Sinica, 2022, 51(6): 0606002
    Download Citation