• Chinese Journal of Lasers
  • Vol. 47, Issue 5, 0511001 (2020)
Wen Sha1, Jiangtao Li1, and Cuiping Lu2、*
Author Affiliations
  • 1School of Electrical Engineering and Automation, Anhui University, Hefei, Anhui 230061, China
  • 2School of Advanced Manufacturing Engineering, Hefei University, Hefei, Anhui 230601, China
  • show less
    DOI: 10.3788/CJL202047.0511001 Cite this Article Set citation alerts
    Wen Sha, Jiangtao Li, Cuiping Lu. Quantitative Analysis of Mn in Soil Based on Laser-Induced Breakdown Spectroscopy Optimization[J]. Chinese Journal of Lasers, 2020, 47(5): 0511001 Copy Citation Text show less
    Schematic of LIBS system
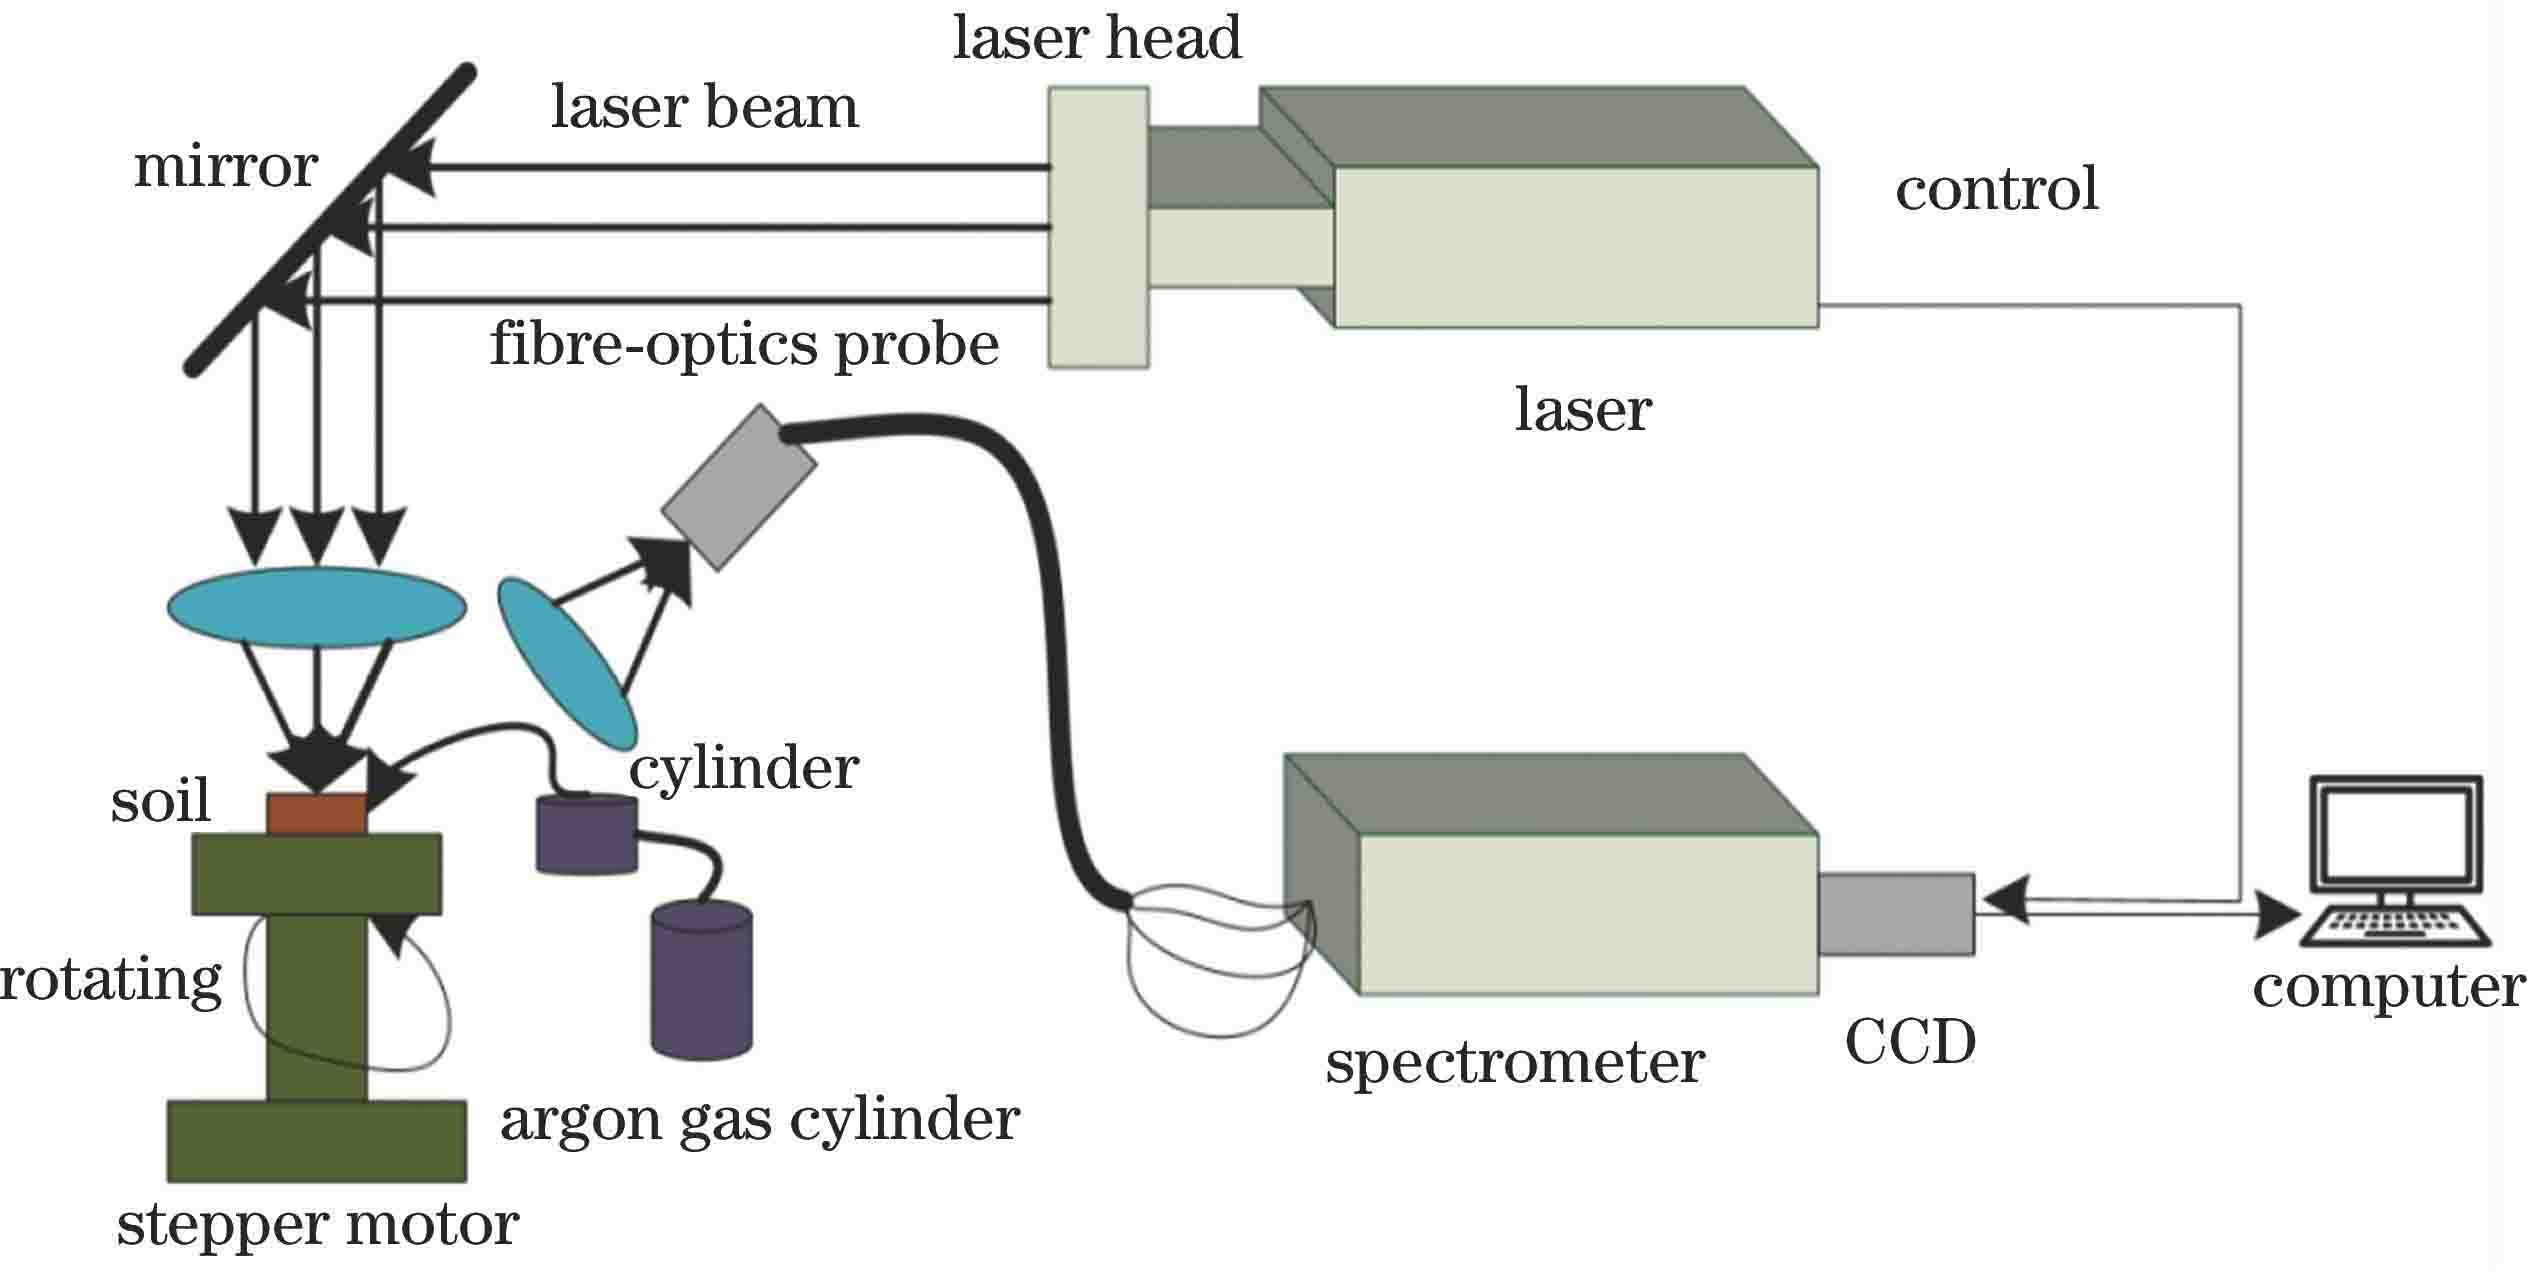
    Fig. 1. Schematic of LIBS system
    Mn element spectrum of No.1 soil sample
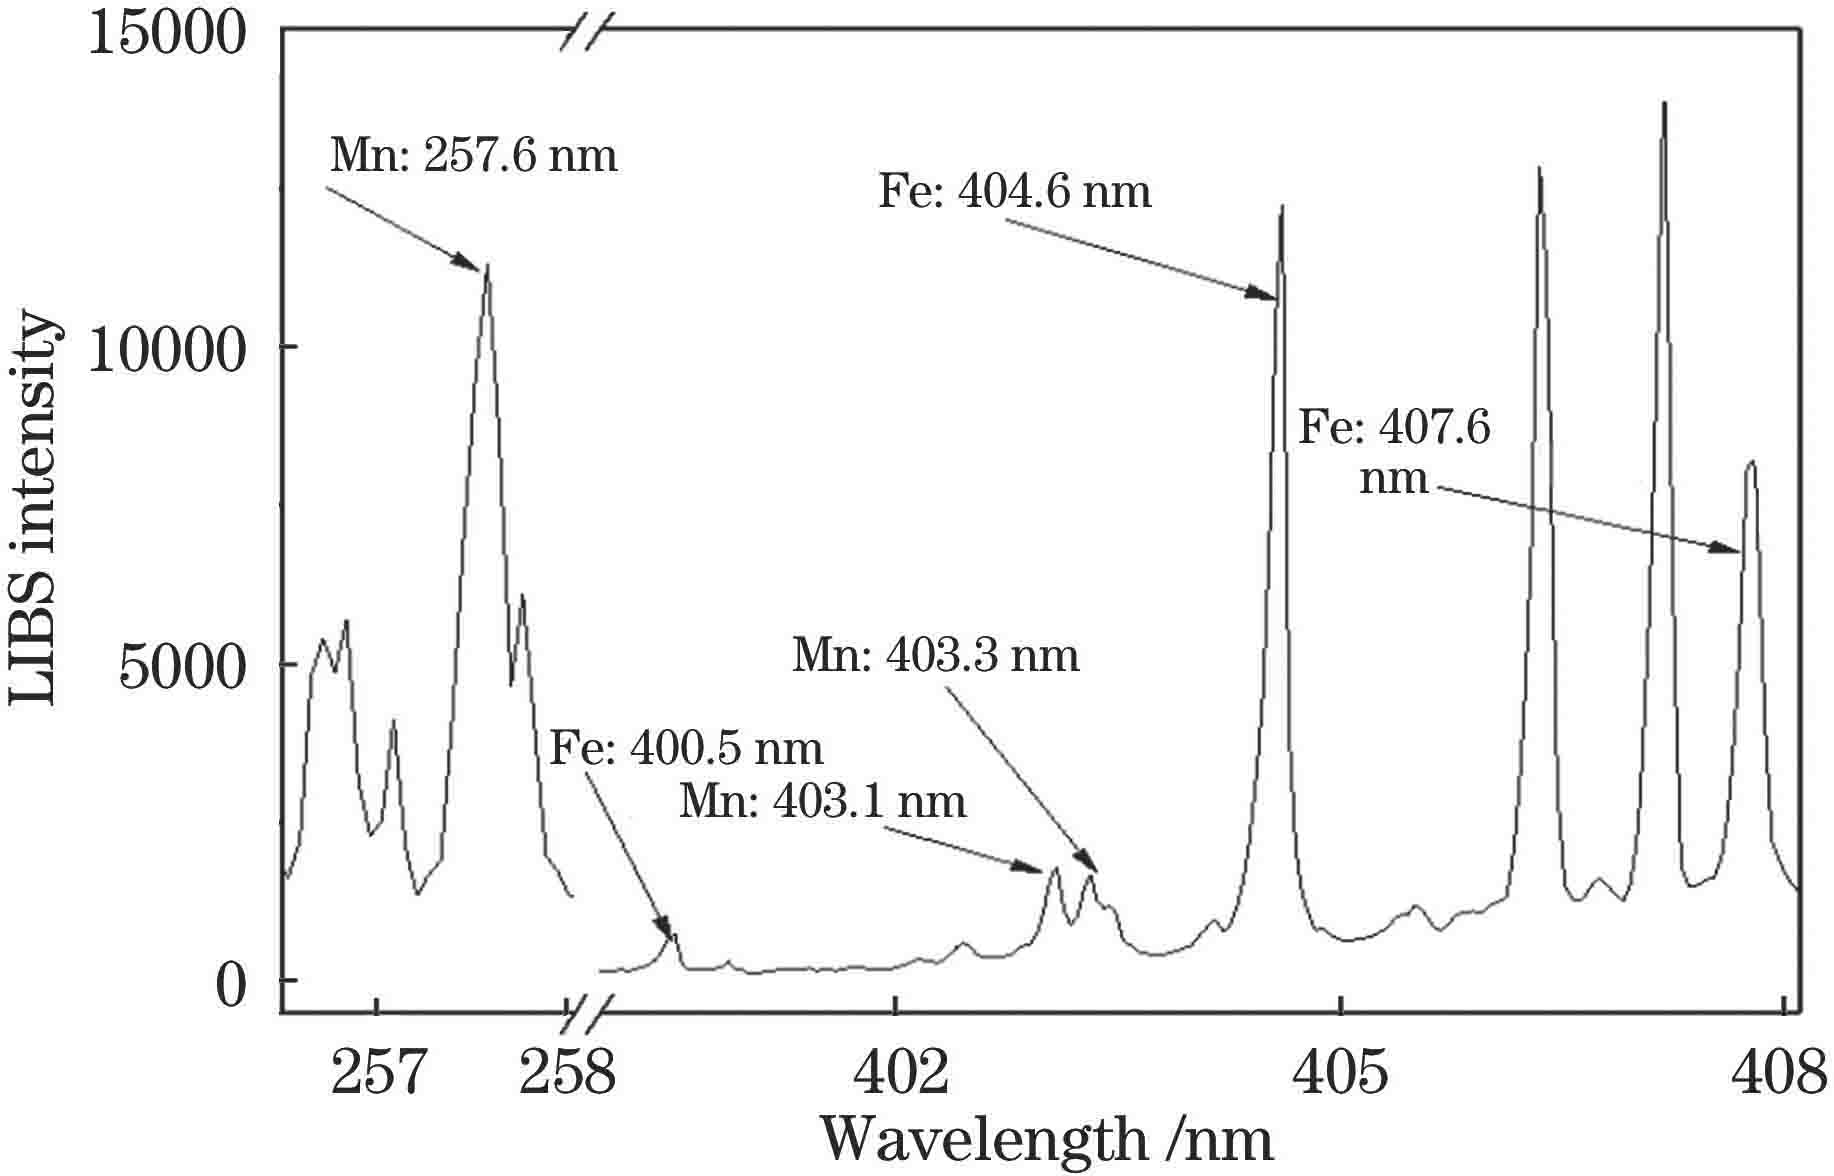
    Fig. 2. Mn element spectrum of No.1 soil sample
    Renderings of GA-SVM method. (a) Training set; (b) test set
    Fig. 5. Renderings of GA-SVM method. (a) Training set; (b) test set
    Renderings of PSO-SVM method. (a) Training set; (b) test set
    Fig. 6. Renderings of PSO-SVM method. (a) Training set; (b) test set
    Renderings of LS-SVM method. (a) Training set; (b) test set
    Fig. 7. Renderings of LS-SVM method. (a) Training set; (b) test set
    Absolute error diagrams of Mn element. (a) Training set; (b) test set
    Fig. 8. Absolute error diagrams of Mn element. (a) Training set; (b) test set
    Training setnumberActualmass fraction /(10-4%)Training setnumberActualmass fraction /(10-4%)Training setnumberActualmass fraction /(10-4%)Test setnumberActualmass fraction /(10-4%)
    11134.6131157.5251229.21533.4
    2432.314622.326788.82540.6
    3468.9151220.527769.23581.1
    4997.8161036.9281333.14613.6
    5905.817498.829728.25622.2
    6650.618510.930523.66666.4
    71184.719906.931619.57717.9
    81470.320499.032633.18751.4
    9744.221643.933789.091025.0
    10703.522973.034827.5101258.7
    11715.923730.5
    12631.124888.1
    Table 1. Actual mass fraction of Mn element
    Parametert /sRtra2Rt2AverageRe /%
    Result1.83130.8660.8978.7
    Table 2. Results of GSM-SVM optimization method
    Parametert /sRtra2Rt2AverageRe /%
    Result3.84750.9390.8947.7
    Table 3. Results of GA-SVM optimization method
    Parametert /sRtra2Rt2AverageRe /%
    Result3.50370.8620.8958.8
    Table 4. Results of PSO-SVM optimization method
    Parametert /sRtra2Rt2AverageRe /%
    Result0.01820.9980.9675.4
    Table 5. Results of LS-SVM optimization method
    No.12345678910Average
    Actual /(10-4%)533.6540.6518.1613.6622.2666.2718.0751.41025.01258.7724.7
    MIR583.7564.1671.4598.0812.5656.9655.5803.71043.61323.9771.3
    GSM575.5568.6685.0604.6828.5661.0658.6800.71037.11316.3773.6
    Predicted /(10-4%)GA529.1516.8592.2590.9715.8601.7529.9699.01088.91232.3709.7
    PSO580.4572.9687.8606.9830.2664.7662.1802.91033.21311.9775.3
    LS616.6587.0556.7625.3652.6686.6702.7703.41060.61316.8750.8
    MIR9.44.315.52.530.61.48.77.01.85.28.6
    GSM7.95.217.91.533.20.88.36.61.24.68.7
    Re/%GA0.84.41.93.715.09.726.27.06.22.17.7
    PSO8.86.018.41.133.40.27.86.90.84.28.8
    LS15.68.64.21.94.93.12.16.43.53.35.4
    Table 6. Relative error of mass fraction of Mn element test set
    Wen Sha, Jiangtao Li, Cuiping Lu. Quantitative Analysis of Mn in Soil Based on Laser-Induced Breakdown Spectroscopy Optimization[J]. Chinese Journal of Lasers, 2020, 47(5): 0511001
    Download Citation