• Photonics Research
  • Vol. 9, Issue 2, 88 (2021)
He Wen1、*, Yuanhang Zhang1, Rachel Sampson1, Nicolas K. Fontaine2, Ning Wang1, Shengli Fan1, and Guifang Li1
Author Affiliations
  • 1CREOL, The College of Optics & Photonics, University of Central Florida, Orlando, Florida 32816-2700, USA
  • 2Bell Laboratories, Alcatel-Lucent, Holmdel, New Jersey 07733, USA
  • show less
    DOI: 10.1364/PRJ.411529 Cite this Article Set citation alerts
    He Wen, Yuanhang Zhang, Rachel Sampson, Nicolas K. Fontaine, Ning Wang, Shengli Fan, Guifang Li. Scalable non-mode selective Hermite–Gaussian mode multiplexer based on multi-plane light conversion[J]. Photonics Research, 2021, 9(2): 88 Copy Citation Text show less

    Abstract

    Non-mode-selective (NMS) multiplexers (muxes) are highly desirable for coherent power combining to produce a high-power beam with a shaped profile (wavefront synthesis) from discrete, phase-locked emitters. We propose a design for a multi-plane light conversion (MPLC)-based NMS mux, which requires only a few phase masks for coherently combining hundreds of discrete input beams into an output beam consisting of hundreds of Hermite–Gaussian (HG) modes. The combination of HG modes as a base can further construct a beam with arbitrary wavefront. The low number of phase masks is attributed to the identical zero-crossing structure of the Hadamard-coded input arrays and of the output HG modes, enabling the practicality of such devices. An NMS mux supporting 256 HG modes is designed using only seven phase masks, and achieves an insertion loss of -1.6 dB, mode-dependent loss of 4.7 dB, and average total mode crosstalk of -4.4 dB. Additionally, this design, featuring equal power for all input beams, enables phase-only control in coherent power combining, resulting in significant simplifications and fast convergence compared with phase-and-amplitude control.

    1. INTRODUCTION

    Mode multiplexers/demultiplexers are widely used in space-division multiplexing (SDM) [15], free-space optical communication [6], coherent power combining [79], and wavefront analysis/synthesis [10]. One of the effective constructions of mode (de)multiplexers is based on multiplane light conversion (MPLC). So far, MPLC-based (de)multiplexers are mode selective (MS); each output mode is derived from only one input [11]. The transfer matrix representing the input–output relations for ideal MS (de)multiplexers is diagonal. For applications such as coherent power combining, in which multiple discrete input Gaussian beams are combined and transformed into a single beam essentially without power loss, an MS multiplexer simply cannot perform this function. To do so, one needs a non-mode-selective multiplexer (NMS mux) in which each output mode is a superposition of all inputs. Therefore, the transfer matrix for the NMS mux has nonzero off-diagonal elements [7]. Very recently, an MPLC-based NMS mux for coherent power combining was proposed [9]. However, that scheme only supported a few HG0n modes by arranging inputs in a line without any information on the phase masks. To the best of the authors’ knowledge, MPLC-based NMS (de)multiplexers supporting hundreds of modes have not been demonstrated so far. This is, in part, because a systematic method of finding the unitary transfer matrix does not exist. Although the Gram–Schmidt process [12] can be used to convert an arbitrary matrix into a unitary matrix, the value of the matrix elements will most likely be distributed over a large range. This large variation incurs high losses because of the need to attenuate the powers of a subset of inputs. Another drawback of the Gram–Schmidt process is that the resulting transfer matrix is not guaranteed to yield an MPLC-based NMS mux with a reduced number of phase masks, which determines its loss. Generally, the number of phase masks required is about 1.5–2 times the supported number of modes to achieve acceptable performance. This means most mode multiplexers supporting a large number of modes are unpractical. So far, only one scheme for MS Hermite–Gaussian (HG)-mode multiplexers [13] broke this limit. The underlying mechanism is still not clear.

    In this paper, we present an approach to design MPLC-based NMS mux for HG modes. To generate each HG mode, the powers of all inputs remain the same while their phases form a Hadamard code. Furthermore, the Hadamard-coded inputs are arranged in a square array so that the symmetry and zero crossings in the input are the same as those of the corresponding output HG modes. This geometric structural similarity enables us to construct a 256 HG-mode NMS mux using only seven phase masks with performances comparable to those of MPLC-based MS multiplexers for HG modes.

    2. MPLC BASED NON-MODE-SELECTIVE MODE MULTIPLEXER DESIGN

    We illustrate our approach for a 16-mode NMS mux using Hadamard-coded [14] input beams arranged in a 4×4 square as shown in Fig. 1(a). All of the inputs have equal power. The phase of each input beam is set to 0 or π, so that their field amplitudes are either +1 or 1. Each input represents one element of the Hadamard codewords with a 16-bit length. There are 16 codewords in this Hadamard code set, in which different codewords are orthogonal. To generate the HG00 mode in Fig. 1(d), we code the field amplitude of the 16 inputs to be all “1”s, as shown in Fig. 1(c), with no zero crossings. For the HG01 mode in Fig. 1(f), the field amplitudes of the first eight inputs are “1”s, and the rest are “1”s with one zero crossing along the x axis as shown in Fig. 1(e). Similarly, for the HG32 in Fig. 1(h), the input array is coded as [1111; 1111; 1111; 1111] with three and two zero crossings in the horizontal and vertical directions, respectively, as shown in Fig. 1(g). The Hadamard codewords in the 4×4 square have zero-crossing layouts identical to their corresponding output HG modes. Namely, the coded input array reflects the geometric characteristics of the output HG modes.

    Hadamard-coded MPLC-based NMS mux for 16 HG modes. (a) Input array; (b) the HG mode set that can be generated using this NMS mux; (c) the input array coded to produce (d) the desired output HG0,0 mode; (e) the input array coded to produce (f) the desired output HG0,1 mode; (g) the input array coded to produce (h) the desired output HG3,2 mode. The locations of the zero crossings, where the adjacent spots change from negative to positive or vice versa, are identical for the input array and output modes, and they are marked by arrows. This similarity allows for a reduced number of phase plates.

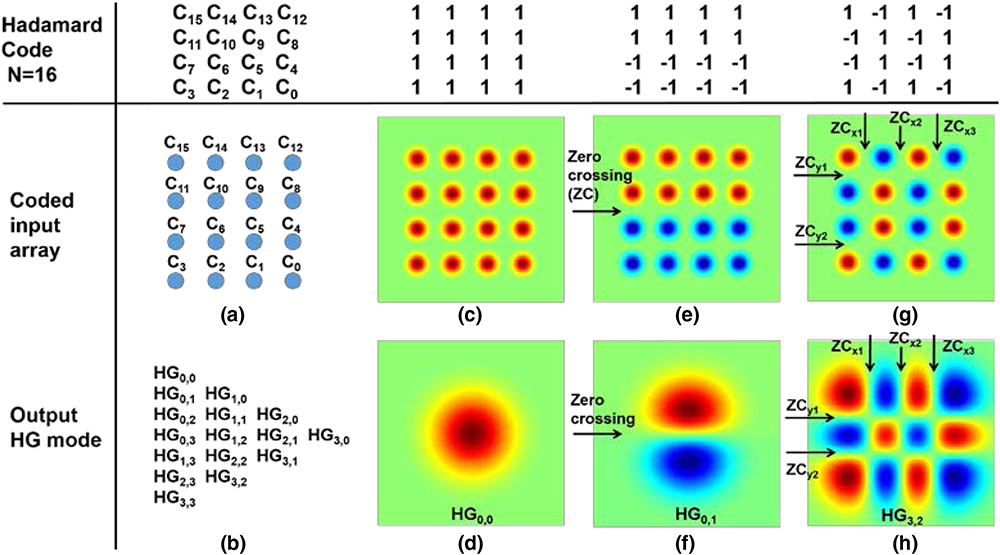
    Figure 1.Hadamard-coded MPLC-based NMS mux for 16 HG modes. (a) Input array; (b) the HG mode set that can be generated using this NMS mux; (c) the input array coded to produce (d) the desired output HG0,0 mode; (e) the input array coded to produce (f) the desired output HG0,1 mode; (g) the input array coded to produce (h) the desired output HG3,2 mode. The locations of the zero crossings, where the adjacent spots change from negative to positive or vice versa, are identical for the input array and output modes, and they are marked by arrows. This similarity allows for a reduced number of phase plates.

    Based on this approach, we need 4M inputs arranged in a square, where M is a positive integer, to generate 4M HG modes. This number is determined by the Hadamard code length together with the square layout of the inputs. The 4MHGmn modes belong to the mode groups with group indices ranging from m+n=0 to m+n=2M+12, where m and n are the number of zero crossings in the horizontal and vertical directions of the HG mode field. The highest-order HG mode will be HG(2M1)(2M1), and therefore the first 2M HG mode groups with mode group indices from m+n=0 to m+n=2M1 will be complete, containing all the modes in the groups, while the remaining 2M1 mode groups will be incomplete with 2M+1(m+n+1) modes in the corresponding group. This is reflected in Fig. 1(b) for the mode set with M=2. The mode composition differs from that of MS multiplexers, in which all mode groups are complete.

    For the given design, to generate pure HG modes, such as the HG00 mode, all inputs have equal power, meaning only phase control is needed. By contrast, other non-mode-selective mode multiplexing schemes generally require both amplitude and phase control, making the systems more complicated and most likely with higher loss.

    3. SIMULATION VERIFICATION

    In our simulation, we modeled an MPLC-based NMS mux for 256 HG modes, with 256 inputs arranged in a 16×16 array. The beam waists of the input Gaussian beam and output HG modes were 30 μm and 170.2 μm, respectively. The beam spacing in the input array was 101.8 μm. Seven phase masks with an axial propagation distance of 28 mm were used to construct the mode multiplexer. Each phase mask was composed of 1024×1024 pixels with a pixel size of 8 μm. The phase shift offered by each pixel was quantized to 64 equally spaced levels between 0 and 2π at 1550 nm. Each phase mask modulates the wavefront of the incident beam, and free-space propagation converts the phase modulation into intensity redistribution through diffraction. The angular spectrum method (ASM) was used to simulate the beam propagation. To calculate the phase mask patterns, the wavefront matching algorithm [15] was used to iteratively update the phase patterns.

    The seven calculated phase masks are shown in Fig. 2(a). The normalized intensities of the HG0,0, HG12,9 modes and all 256 modes at each phase mask are plotted in Figs. 2(b)–2(d), respectively. The phase masks and the total intensity of all modes look as symmetric as a square is, determined by the common symmetry of the input array and the output HG modes. The first phase mask, with fast varying patterns except for the four vertices, diffracts the input spots into areas around the four vertices of the input array. The second phase mask further disperses the beams away from the four vertices. The third to the sixth phase masks regulate the beams by reshaping them, pushing them toward the center of the input array, and finally forming the desired profiles. The last phase mask provides necessary phase shifts to improve the fidelity of all modes. All of the insets are zoomed in by a factor of 2 for a better view.

    (a) Calculated phase patterns for the seven phase masks used in the MPLC-based NMS mux supporting 256 HG modes; (b)–(d) normalized intensity of the HG0,0, HG12,9 modes and all 256 HG modes at each phase mask.

    Figure 2.(a) Calculated phase patterns for the seven phase masks used in the MPLC-based NMS mux supporting 256 HG modes; (b)–(d) normalized intensity of the HG0,0, HG12,9 modes and all 256 HG modes at each phase mask.

    Figure 3 shows the input and output fields of some modes in comparison with the desired output ones. The output fields are very similar to the desired ones with identical zero-crossing structure and only minor differences, such as mode width and smoothness of lobes, indicating successful conversion of the inputs to the desired outputs. Identical zero-crossing structure is the dominant factor in determining the number of phase masks. All of the field images are zoomed in by a factor of approximately 3 for a better view.

    Normalized field of some input (left column) and corresponding output (right column) modes generated by the MPLC-based NMS mux in comparison to the target mode (middle column).

    Figure 3.Normalized field of some input (left column) and corresponding output (right column) modes generated by the MPLC-based NMS mux in comparison to the target mode (middle column).

    To quantitatively evaluate the quality of output fields, we calculate the complex coupling coefficients as the overlap integral between the simulated output fields and the desired output fields. The power of the input and the desired output fields is normalized to 1. Figure 4(a) shows the squared magnitude of these coupling coefficients. The diagonal elements range from 0.45 to 0.56, demonstrating the high-level similarities between the actual output and desired output. The off-diagonal elements, ranging from 105 to 0.25, are related to mode crosstalk.

    (a) Transfer matrix, (b) loss, and (c) modal crosstalk of the MPLC-based NMS mux supporting 256 HG modes.

    Figure 4.(a) Transfer matrix, (b) loss, and (c) modal crosstalk of the MPLC-based NMS mux supporting 256 HG modes.

    Using the singular values λ of the transfer matrix Mc, composed of the complex coupling coefficients, we calculated an insertion loss [IL=10log(kλk2/256)] of 1.6  dB and a mode-dependent loss [MDL=10log(λmax2/λmin2)] of 4.7 dB. The IL and MDL are comparable to those of MPLC-based MS muxes having the same number of phase masks.

    To further quantify the variation in the performance among all modes, we calculate the loss and modal crosstalk of each mode as follows: Lossk=20log[|diag(Mc)|k],Xtalkk=10log[r|Mc|k,r2|diag(Mc)|k2]10log[|diag(Mc)|k2],where diag(Mc) is the diagonal elements of Mc, and k and r denote the row (output mode) and column index of the element in the transfer matrix, respectively. The modal losses vary between 3.5 and 2.5  dB with a mean value of 3.0  dB as shown in Fig. 4(b). The greater loss of the higher-order modes is due to the presence of higher frequency components and hence larger angles exceeding the numerical aperture of the NMS mux. The modal crosstalk ranges from 6.8 to 2.1  dB with a mean value of 4.4  dB as shown in Fig. 4(c).

    The IL and MDL as functions of wavelength are plotted in Figs. 5(a) and 5(b), respectively. In the wavelength range from 1.50 to 1.60 μm, the IL and MDL vary about 1.7 dB and 5.1 dB, respectively. The larger variation of the MDL is attributed to the higher sensitivity to wavelength deviation of the mode with the minimum singular value, which contains high-spatial-frequency components. We observe that the bandwidth of the NMS muxes is narrower than that of MS muxes [16,17]. The underlying reason is that the phase masks for the NMS muxes have high-frequency components to match the aspect ratio difference between the input array and output HG modes.

    (a) Insertion loss and (b) mode-dependent loss as functions of wavelength of the MPLC-based NMS mux supporting 256 HG modes.

    Figure 5.(a) Insertion loss and (b) mode-dependent loss as functions of wavelength of the MPLC-based NMS mux supporting 256 HG modes.

    4. CONTROL SCHEMES FOR COHERENT BEAM COMBINING: A COMPARISON

    Our MPLC-based NMS mux can be used to generate pure HG modes, such as the HG00 mode, by coherent power combining with only phase control, rather than both phase and amplitude control. Advantages of phase-only control include simplicity, fast convergence, and low insertion loss. Faster convergence results from the reduced search space as well as reduced number of local minima.

    To demonstrate the advantage of phase-only control, we designed a 16-mode MPLC-based NMS mux with five phase masks with an area 1/16 of that for the 256-mode NMS mux to synthesize a fundamental-mode output. For phase-only control, the initial phases of the inputs are randomly set, while for phase-and-amplitude control, both phase and amplitude are randomly set. In both cases, the 16 inputs deviate from the desired state where the inputs have identical power and phase. The stochastic parallel-gradient-descent (SPGD) algorithm [18] was used to restore the inputs to the desired state by updating the phase/amplitude of the inputs until the power of synthesized beam within a predefined radius does not increase in five consecutive updates. This process is repeated 2000 times for different initial input states.

    Figure 6 presents the results of the two control schemes for one of the 2000 initial states with the 16 amplitudes and phases in Figs. 6(c) and 6(f), respectively. The 16 inputs plotted in blue circles were initialized with the same random phases in the two control schemes; the amplitude in the amplitude-and-phase control scheme randomly deviates from 1 within the range between 0.5 and 2. The output beams before SPGD control have multiple speckles as shown in Figs. 6(a) and 6(d). After SPGD control, the output beams look more Gaussian, although some weak speckles remain as shown in Figs. 6(b) and 6(e). The output power for the phase-only control scheme is greater than for the amplitude-and-phase control scheme. This is evident in Figs. 6(c) and 6(f), where the amplitudes and phases of the 16 inputs after SPGD control are plotted using red squares. For the phase-only control scheme, the amplitude is always 1. In contrast, for the phase-and-amplitude control scheme, the amplitudes of some inputs drop below 1.

    Comparison of (a)–(c) amplitude-and-phase control with (d)–(f) phase-only control by SPGD for coherent power combination with a NMS mux supporting 16 inputs. (a), (d) Output intensity before control; (b), (e) output intensity after control; (c), (f) the phase and amplitude of inputs before (blue) and after (red) control.

    Figure 6.Comparison of (a)–(c) amplitude-and-phase control with (d)–(f) phase-only control by SPGD for coherent power combination with a NMS mux supporting 16 inputs. (a), (d) Output intensity before control; (b), (e) output intensity after control; (c), (f) the phase and amplitude of inputs before (blue) and after (red) control.

    Better beam quality in terms of fidelity and faster convergence speed is also achieved with the phase-only control scheme. This can be seen by comparing the output power within a predefined radius equal to half width at half-maximum of the fundamental Gaussian beam, the power contained in the fundamental mode of the output beam, and the fidelity of the output beam as a function of SPGD iteration number shown in Figs. 7(a)–7(c), respectively. The results in Fig. 7 were the mean and error bars of the 2000 samples. Clearly, the phase-only control scheme has larger mean value and smaller variation throughout the adjustment process. From Figs. 7(d) and 7(e),the median of the normalized fundamental mode power for the phase-only control scheme was 0.70, outperforming the amplitude-and-phase control scheme, which had a median of 0.26. The reason for this difference is that amplitude control would reduce the power of some inputs out of phase relative to others [at opposite ends of diameters of the circles in Figs. 6(c) and 6(f)] to increase the total power in a defined aperture, whereas phase control tries to reduce the phase differences without attenuating amplitudes. In the amplitude-and-phase control scheme, the powers of the out-of-phase inputs usually cannot reduce to zero because of random perturbations and finite step sizes. The residual out-of-phase input introduces wavefront distortions and degrades the fundamental power. In contrast, there is no residual out-of-phase input in the phase control scheme, resulting in less distorted wavefront or stronger fundamental power. This difference is the reason why the fundamental power can be weaker than the power in the defined aperture in the amplitude-and-phase control scheme but always stronger in the phase control scheme, as well as the difference between the fundamental power histograms of the two control schemes.

    Comparison between amplitude-and-phase control and phase-only control. (a) The average power of output beam in defined aperture and its error bar, (b) average fundamental mode power in the output beam and its error bar, and (c) average fidelity of the output beam and its error bar over 2000 samples as functions of adjustment times in the control process. Histogram of fundamental mode power in the output beam for 2000 samples for (d) amplitude-and-phase control and (e) phase-only control.

    Figure 7.Comparison between amplitude-and-phase control and phase-only control. (a) The average power of output beam in defined aperture and its error bar, (b) average fundamental mode power in the output beam and its error bar, and (c) average fidelity of the output beam and its error bar over 2000 samples as functions of adjustment times in the control process. Histogram of fundamental mode power in the output beam for 2000 samples for (d) amplitude-and-phase control and (e) phase-only control.

    5. COMPARISON BETWEEN HADAMARD CODING AND FOURIER CODING

    We considered another code set with all code elements having equal magnitude, such as the Fourier code set exp(i2πmn/N),m,n=0,,N1, which extends binary code on the real axis to multinary code on the unit circle in the complex plane. In this case, the mode multiplexer becomes a discrete Fourier transform (DFT) processor, which performs the DFT of the input and generates the HG modes as the coefficients of the input spectrum. This DFT processor can be used in applications like fast detection of HG mode components in an arbitrary incident wavefront, optical orthogonal-frequency-division multiplexing (OFDM) transmission, etc., which will be studied in future work. The advantage of Fourier coding is that the number of inputs can be arbitrary instead of 4M such as in Hadamard coding, and the associated disadvantage is that more phase masks are required to achieve comparable performance because of the lack of consistent zero-crossing structures between the inputs and output HG modes.

    To show the merit of Hadamard coding specifically, we compare the performance of two NMS muxes supporting 16 inputs, one coded by Hadamard code set and the other by Fourier code set. The Fourier coding is described by FCk=FCp, parg{maxpS[Re(qHCkq·FCpq)]}, interpreted as that the Fourier code to match the mode k is the one in the available set with the maximum correlation with the Hadamard-coded input array for the mode k, where q is the index of the code element, p is the index of the Fourier code for selection, and S is the index set of the Fourier codes that have been selected to pair with the corresponding Hadamard codes. This coding scheme leads to the minimum IL compared with other schemes because it takes advantage of the zero-crossing structure used in the Hadamard coding scheme. Figure 8(a) shows the optimized Fourier code set for a 16-input array in the middle column, in comparison with a randomly permutated one in the right column. We used pseudo color to represent the phase of each element since they all have equal power. For a better contrast to the background (zero phase), we rotate all phases by 0.5π. The numbers in the insets denote the absolute values of the real part of the correlation coefficients between the input arrays in the same row coded by the Fourier code sets and the Hadamard code set in the left column. Matrices composed of these numbers for all input arrays’ correlation are plotted in Figs. 8(b) and 8(c). The correlation coefficients with large values are located along the diagonal of the matrix for the optimized coding scheme against the randomly permutated one. Moreover, the matrix is transpose symmetric, which indicates, to a certain extent, a similar structure of the proposed code set to that of the Hadamard code set. This can explain why the optimized Fourier code set produces much lower IL (in a red star) than 1000 randomly permutated code sets do in Figs. 8(d) and 8(e).

    Comparison between the optimized Fourier and randomly permutated Fourier coding schemes for an MPLC-based NMS mux for 16 inputs. (a) Coded phase of input array by the Hadamard coding (left), the optimized Fourier coding (middle), and a randomly permutated Fourier coding (right); matrix composed of the absolute values of the real part of the correlation coefficients between the Hadamard code set and (b) the optimized Fourier code set and (c) the randomly permutated Fourier code set; (d) MDL versus IL and (e) averaged total mode crosstalk versus IL of the 16-input NMS muxes using optimized Fourier coding (red star) and 1000 randomly permutated Fourier coding (blue circles).

    Figure 8.Comparison between the optimized Fourier and randomly permutated Fourier coding schemes for an MPLC-based NMS mux for 16 inputs. (a) Coded phase of input array by the Hadamard coding (left), the optimized Fourier coding (middle), and a randomly permutated Fourier coding (right); matrix composed of the absolute values of the real part of the correlation coefficients between the Hadamard code set and (b) the optimized Fourier code set and (c) the randomly permutated Fourier code set; (d) MDL versus IL and (e) averaged total mode crosstalk versus IL of the 16-input NMS muxes using optimized Fourier coding (red star) and 1000 randomly permutated Fourier coding (blue circles).

    Next, we compare the optimized Fourier coding with Hadamard coding by keeping the same simulation parameters. The IL, MDL, and total averaged modal crosstalk of the NMS muxes constructed by four to eight phase masks are plotted in Figs. 9(a)–9(c), respectively. Clearly, Hadamard coding has better performance than Fourier coding.

    Comparison between the Fourier and Hadamard coding schemes for an MPLC-based NMS mux for 16 inputs in terms of (a) insertion loss, (b) mode-dependent loss, and (c) averaged total mode crosstalk with different numbers of phase masks.

    Figure 9.Comparison between the Fourier and Hadamard coding schemes for an MPLC-based NMS mux for 16 inputs in terms of (a) insertion loss, (b) mode-dependent loss, and (c) averaged total mode crosstalk with different numbers of phase masks.

    The advantage of Hadamard coding is more obvious when increasing the number of supported modes. A similar comparison is carried out for a fixed number of phase masks (seven), but with a varying number of inputs and the same number of output HG modes, 16, 64, and 256. The results are shown in Figs. 10(a)–10(c). Clearly, the performance advantage of Hadamard coding in terms of IL and MDL becomes significant at 64 and 256 modes. The enlarged performance difference for a larger number of modes is due to the identical zero-crossing structure of the input array and output HG modes for Hadamard coding, whereas the correlation between the optimized Fourier and Hadamard code sets decreases. The results indicate that the Hadamard-coded NMS muxes are scalable with the number of modes, whereas the Fourier-coded ones are not.

    Comparison between the Fourier and Hadamard coding schemes for an MPLC-based NMS mux with seven phase masks for different number of inputs in terms of (a) insertion loss, (b) mode-dependent loss, and (c) averaged total mode crosstalk.

    Figure 10.Comparison between the Fourier and Hadamard coding schemes for an MPLC-based NMS mux with seven phase masks for different number of inputs in terms of (a) insertion loss, (b) mode-dependent loss, and (c) averaged total mode crosstalk.

    6. APPLICATIONS IN BEAM SYNTHESIS

    Another promising application of the NMS muxes is beam synthesis, in which an arbitrary beam is produced by controlling both the amplitude and phase of each element of the input array. This functionality, as a generalization of power combining, makes NMS muxes different from power combiners (in which only the fundamental mode is usually synthesized). Since the outputs of NMS muxes form a complete orthogonal mode base, an arbitrary beam can be decomposed into this mode base. The modal coefficients determine the amplitude and phase of each element of the input array as given by Eq. (3), where amn is the coefficient of the HGmn mode in the synthesized beam; cmn,j is the coefficient of the input element j (1 or 1 as illustrated in Fig. 1) to the generated HGmn mode; uj(x,y) is the electric field profile of the input element j; and K(x,y;x,y) is the kernel function of the designed NMS muxes. The kernel function, analogous to the impulse response function of a linear time-invariant system in the time domain, describes the entire behavior of the NMS muxes: U(x,y)=mnamnHGmn(x,y)=mnamnK(x,y;x,y)jcmn,juj(x,y)dxdy=K(x,y;x,y)jdjuj(x,y)dxdy,dj=mnamncmn,j.

    In Fig. 11, we plot 16 synthesized Laguerre–Gaussian (LG) modes by the designed 256-mode NMS mux. The LGlp modes belong to different mode groups with mode group numbers |l|+2p ranging from 0 to 15, where l and p are the azimuthal and radial mode numbers, respectively. There are five images for each LG mode. They are (from the left to right): the input array intensity, intensity of the synthesized LG mode by passing the input array through the NMS mux, the interferogram of the synthesized LG mode interfering with a fundamental Gaussian mode with a positive wavefront curvature to show the spiral wavefront of some LG modes, and the intensity and interferogram of an ideal LG mode. The coefficient amn for each LGlp mode is calculated by using Eq. (9) in Ref. [19]. The squared magnitude of the coupling coefficients between the synthesized and ideal LG modes shown in each panel are around 0.5, close to those between the generated and ideal HG modes in Fig. 3 and those in a previously demonstrated MS HG-mode multiplexer [17].

    Comparison of the synthesized and ideal LG modes and their corresponding interferogram resulting from interfering with a fundamental Gaussian mode with a positive wavefront curvature. The 16 LG modes belong to different mode groups with mode group numbers ranging from 0 to 15. The numbers in the figure are the squared magnitude of the coupling coefficients between the synthesized and corresponding ideal LG modes.

    Figure 11.Comparison of the synthesized and ideal LG modes and their corresponding interferogram resulting from interfering with a fundamental Gaussian mode with a positive wavefront curvature. The 16 LG modes belong to different mode groups with mode group numbers ranging from 0 to 15. The numbers in the figure are the squared magnitude of the coupling coefficients between the synthesized and corresponding ideal LG modes.

    Different from HG mode generation, the power contribution from each input element to most LG modes is unequal, and therefore both amplitude control and phase control are needed. It is worth mentioning that the number of input elements with power contribution is larger than the required number of HG modes in the same mode group to synthesize a certain LG mode. Hence, the power of LG modes synthesized using a NMS mux is higher than by an MS mux, assuming that the power in the input element is equal.

    7. CONCLUSION

    An NMS mux based on MPLC for HG modes is designed and demonstrated by simulation. The Hadamard-coded input arrays are arranged with an identical zero-crossing structure to that of the desired HG modes, leading to a significant reduction in the number of required phase masks. Only seven phase masks were required for a 256-mode NMS mux. This device could be very useful for high-power coherent beam combining with phase-only control. Further increasing the number of supported modes is limited by the size and spatial resolution of the phase masks. As the number of modes goes up, the phase masks have to be enlarged to capture all the modes. The spatial resolution of the phase masks has to be increased accordingly to accommodate higher-spatial-frequency components contained in the higher-order modes. Phase masks with high resolution are hard to fabricate and pose difficulty in assembly and alignment. These limitations are common issues to all devices based on MPLCs, not uniquely associated with our proposed technique.

    References

    [1] R. Ryf, S. Randel, A. H. Gnauck, C. Bolle, R. Essiambre, P. J. Winzer, D. W. Peckham, A. McCurdy, R. Lingle. Space-division multiplexing over 10 km of three-mode fiber using coherent 6 × 6 MIMO processing. Optical Fiber Communication Conference and Exposition and National Fiber Optic Engineers Conference, 1-3(2011).

    [2] E. Ip, N. Bai, Y. K. Huang, E. Mateo, F. Yaman, M. J. Li, S. Bickham, S. Ten, J. Liñares, C. Montero, V. Moreno, X. Prieto, V. Tse, K. M. Chung, A. Lau, H. Y. Tam, C. Lu, Y. Luo, G. D. Peng, G. Li. 88×3×112-Gb/s WDM transmission over 50 km of three-mode fiber with inline few mode fiber amplifier. 37th European Conference and Exposition on Optical Communications, Th.13.C.12(2011).

    [3] H. Wen, C. Xia, A. M. Velázquez-Benítez, N. Chand, J. E. Antonio-Lopez, B. Huang, H. Liu, H. Zheng, P. Sillard, X. Liu, F. Effenberger, R. Amezcua-Correa, G. Li. First demonstration of six-mode PON achieving a record gain of 4 dB in upstream transmission loss budget. J. Lightwave Technol., 34, 1990-1996(2016).

    [4] H. Liu, H. Wen, J. C. A. Zacarias, J. E. Antonio-Lopez, N. Wang, P. Sillard, A. A. Correa, R. Amezcua-Correa, G. Li. 3×10 Gb/s mode group-multiplexed transmission over a 20 km few-mode fiber using photonic lanterns. Optical Fiber Communication Conference, M2D.5(2017).

    [5] G. Labroille, N. Barré, O. Pinel, B. Denolle, K. Lenglé, L. Garcia, L. Jaffrès, P. Jian, J.-F. Morizur. Characterization and applications of spatial mode multiplexers based on multi-plane light conversion. Opt. Fiber Technol., 35, 93-99(2017).

    [6] J. Wang, J.-Y. Yang, I. M. Fazal, N. Ahmed, Y. Yan, H. Huang, Y. Ren, Y. Yue, S. Dolinar, M. Tur, A. E. Willner. Terabit free-space data transmission employing orbital angular momentum multiplexing. Nat. Photonics, 6, 488-496(2012).

    [7] J. Montoya, C. Aleshire, C. Hwang, N. K. Fontaine, A. Velázquez-Benítez, D. H. Martz, T. Y. Fan, D. Ripin. Photonic lantern adaptive spatial mode control in LMA fiber amplifiers. Opt. Express, 24, 3405-3413(2016).

    [8] J. Montoya, C. Hwang, D. Martz, C. Aleshire, T. Y. Fan, D. J. Ripin. Photonic lantern kW-class fiber amplifier. Opt. Express, 25, 27543-27550(2017).

    [9] A. Billaud, F. Gomez, D. Allioux, N. Laurenchet, P. Jian, O. Pinel, G. Labroille. Optimal coherent beam combining based on multi-plane light conversion for high throughput optical feeder links. IEEE International Conference on Space Optical Systems and Applications (ICSOS), 1-5(2019).

    [10] H. Wen, H. Liu, Y. Zhang, R. Sampson, S. Fan, G. Li. Scalable Hermite–Gaussian mode-demultiplexing hybrids. Opt. Lett., 45, 2219-2222(2020).

    [11] S. G. Leon-Saval, N. K. Fontaine, J. R. Salazar-Gil, B. Ercan, R. Ryf, J. Bland-Hawthorn. Mode-selective photonic lanterns for space-division multiplexing. Opt. Express, 22, 1036-1044(2014).

    [12] G. Arfken. Gram-Schmidt orthogonalization. Mathematical Methods for Physicists, 516-520(1985).

    [13] J. Carpenter, N. K. Fontaine. Multi-plane light conversion with low plane count. Conference on Lasers and Electro-Optics Europe and European Quantum Electronics Conference (CLEO/Europe-EQEC)(2017).

    [14] J. H. van Lint. Hadamard codes and generalizations. Introduction to Coding Theory, 47-48(1999).

    [15] Y. Sakamaki, T. Saida, T. Hashimoto, H. Takahashi. New optical waveguide design based on wavefront matching method. J. Lightwave Technol., 25, 3511-3518(2007).

    [16] N. K. Fontaine, R. Ryf, H. Chen, D. Neilson, J. Carpenter. Design of high order mode-multiplexers using multiplane light conversion. European Conference on Optical Communication (ECOC), 1-3(2017).

    [17] N. K. Fontaine, R. Ryf, H. Chen, D. T. Neilson, K. Kim, J. Carpenter. Laguerre-Gaussian mode sorter. Nat. Commun., 10, 1865(2019).

    [18] M. A. Vorontsov, V. P. Sivokon. Stochastic parallel-gradient-descent technique for high-resolution wave-front phase-distortion correction. J. Opt. Soc. Am. A, 15, 2745-2758(1998).

    [19] M. W. Beijersbergen, L. Allen, H. E. L. O. van der Veen, J. P. Woerdman. Astigmatic laser mode converters and transfer of orbital angular momentum. Opt. Commun., 96, 123-132(1993).

    He Wen, Yuanhang Zhang, Rachel Sampson, Nicolas K. Fontaine, Ning Wang, Shengli Fan, Guifang Li. Scalable non-mode selective Hermite–Gaussian mode multiplexer based on multi-plane light conversion[J]. Photonics Research, 2021, 9(2): 88
    Download Citation