• Acta Photonica Sinica
  • Vol. 53, Issue 2, 0204001 (2024)
Jianan WEI1、2, Hulin LIU2, Ping CHEN2、3、*, Yang LI4, Kuinian LI2, Yonglin WEI2, Luanxuan HE1、2, Xinnan ZHAO1、2, Xiaofeng SAI2, Deng LIU5, Jinshou TIAN2、3, and Wei ZHAO2、3
Author Affiliations
  • 1University of Chinese Academy of Sciences,Beijing 100049,China
  • 2Key Laboratory of Ultra-fast Photoelectric Diagnostics Technology,Xi'an Institute of Optics and Precision Machinery,Chinese Academy of Sciences,Xi'an 710119,China
  • 3Extreme Optics Collaborative Innovation Center,Shanxi University,Taiyuan 030006,China
  • 4State Key Laboratory of Environmental Simulation and Effects of Intense Pulse Radiation,Northwest Nuclear Technology Research Institute,Xi'an 710024,China
  • 5A Center of Equipment Development Department,Beijing 100034,China
  • show less
    DOI: 10.3788/gzxb20245302.0204001 Cite this Article
    Jianan WEI, Hulin LIU, Ping CHEN, Yang LI, Kuinian LI, Yonglin WEI, Luanxuan HE, Xinnan ZHAO, Xiaofeng SAI, Deng LIU, Jinshou TIAN, Wei ZHAO. Dynamic Range Study of Microchannel Plate Photomultiplier Tubes under Visible Light Pulse Input[J]. Acta Photonica Sinica, 2024, 53(2): 0204001 Copy Citation Text show less
    The schematic diagram of the structure and working principle of MCP-PMT
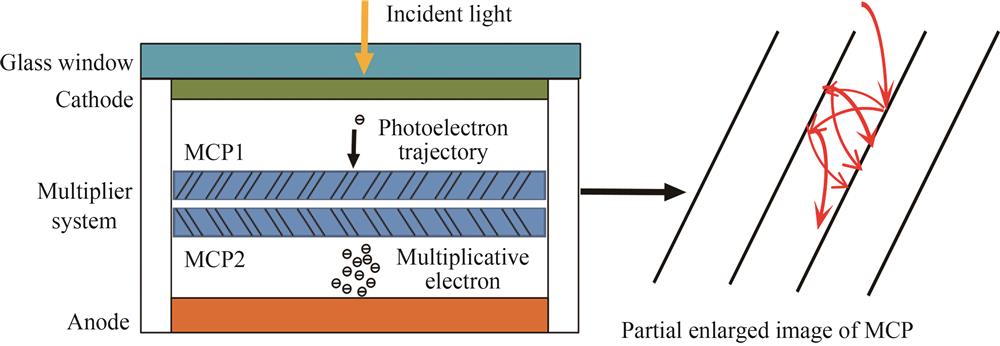
    Fig. 1. The schematic diagram of the structure and working principle of MCP-PMT
    Schematic diagram of a discrete electronic multiplier
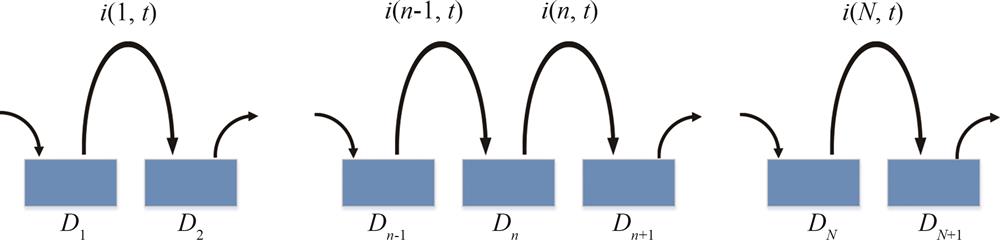
    Fig. 2. Schematic diagram of a discrete electronic multiplier
    Node charging equivalent circuit
    Fig. 3. Node charging equivalent circuit
    Output charge with different s-parameters at an input optical pulse frequency of 1 000 Hz
    Fig. 4. Output charge with different s-parameters at an input optical pulse frequency of 1 000 Hz
    The relationship between the average gain of charge output and frequency
    Fig. 5. The relationship between the average gain of charge output and frequency
    Circuit diagram of charge transfer between plates
    Fig. 6. Circuit diagram of charge transfer between plates
    Electron multiplication inside the microchannel board
    Fig. 7. Electron multiplication inside the microchannel board
    Schematic diagram of parallel electric field distortion at the end of the microchannel plate
    Fig. 8. Schematic diagram of parallel electric field distortion at the end of the microchannel plate
    Experimental flowchart
    Fig. 9. Experimental flowchart
    Test results of the maximum linear voltage of the anode
    Fig. 10. Test results of the maximum linear voltage of the anode
    The relationship between anode peak voltage and linear deviation at different frequencies
    Fig. 11. The relationship between anode peak voltage and linear deviation at different frequencies
    Schematic of the shape of strong and weak pulse input light waves
    Fig. 12. Schematic of the shape of strong and weak pulse input light waves
    Selection point of maximum linear voltage
    Fig. 13. Selection point of maximum linear voltage
    The relationship between dynamic range and voltage between MCP2-Anode
    Fig. 14. The relationship between dynamic range and voltage between MCP2-Anode
    ParametersSymbolValue

    Resistance/Ω

    Capacitor/F

    Bias voltage/V

    Unsaturated gain

    R

    C

    V

    eGN

    6×10⁸

    5.29×10⁻¹¹

    700

    5 580

    Table 1. Performance parameters of MCP
    Voltage between MCP2-Anode/VDistortion depth/um

    200

    300

    400

    500

    2

    4

    8

    11

    Table 2. The relationship between immersion depth and potential difference
    Filter namesRelative light intensity(I/I0Wavelength applicable range/nm

    01x-A

    02x-A

    03x-A

    04x-A

    05x-A

    06x-A

    10x-A

    79%

    63%

    50%

    40%

    32%

    25%

    10%

    350~620

    320~650

    330~570

    360~630

    350~580

    320~640

    350~670

    Table 3. Relative light intensity of different filters
    ParametersFirst groupSecond groupThird group

    Cathode-MCP1/V

    MCP1/V

    MCP2/V

    MCP2-anode/V

    191

    500

    667

    Variable quantity

    191

    572

    667

    Variable quantity

    191

    667

    667

    Variable quantity

    Table 4. Voltage parameter settings for various parts of MCP-PMT
    Jianan WEI, Hulin LIU, Ping CHEN, Yang LI, Kuinian LI, Yonglin WEI, Luanxuan HE, Xinnan ZHAO, Xiaofeng SAI, Deng LIU, Jinshou TIAN, Wei ZHAO. Dynamic Range Study of Microchannel Plate Photomultiplier Tubes under Visible Light Pulse Input[J]. Acta Photonica Sinica, 2024, 53(2): 0204001
    Download Citation