
Zhen Wang, Yan-Jun Du, Yan-Jun Ding, Zhi-Min Peng. High precision calibration of spectral parameters of CO at 1567 nm based on wavelength modulation-direct absorption spectroscopy [J]. Acta Physica Sinica, 2020, 69(6): 064204-1
- Acta Physica Sinica
- Vol. 69, Issue 6, 064204-1 (2020)
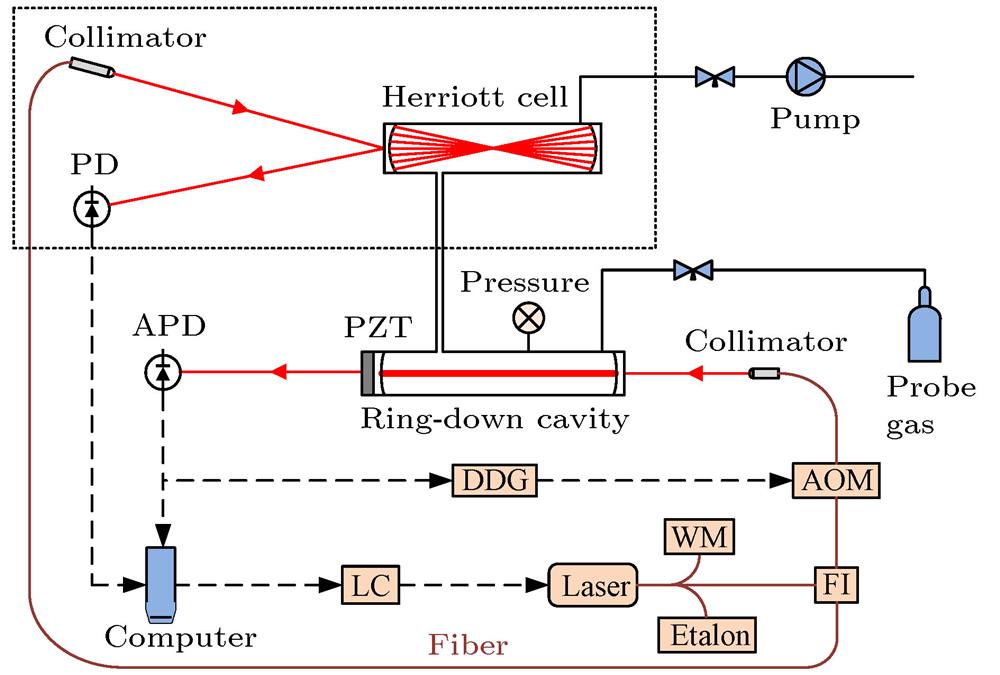
Fig. 1. System schematic diagram of WM-DAS and CW-CRDS. LC, laser current and temperature controller; FI, fiber isolator; AOM, acousto-optic modulator; APD, avalanche photodiode; PD, photodiode; DDG, digital delay generator; PZT, piezoelectric transducer; WM, wavelength meter.
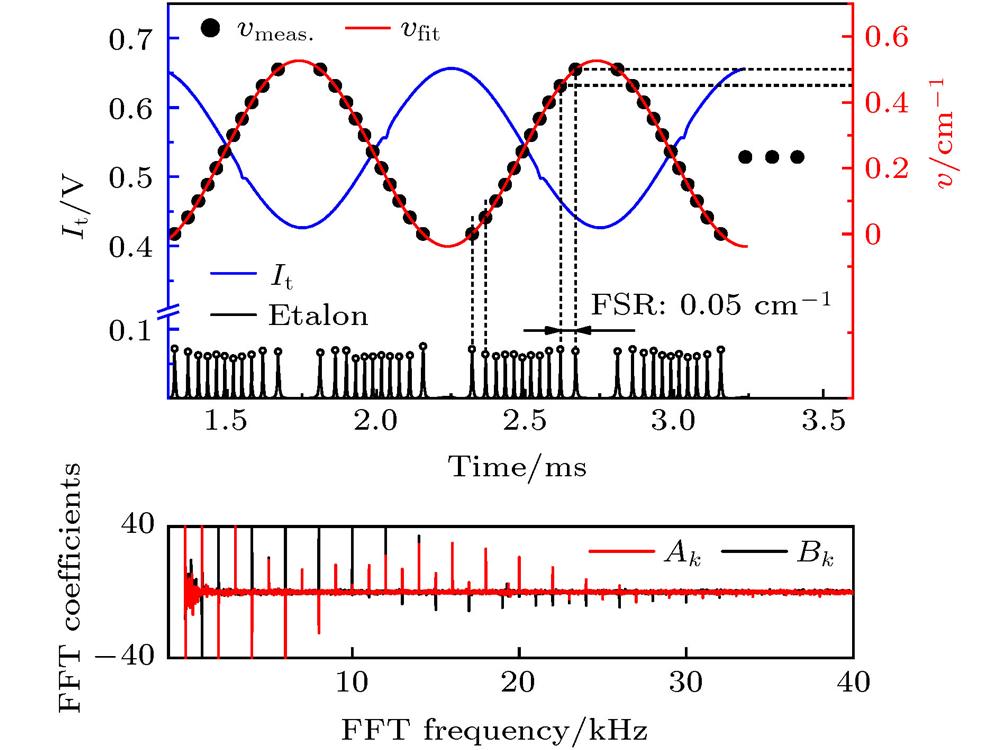
Fig. 2. Measured transmitted intensities of 100 periods of sinusoidal waves and fitted frequency (FSR, free spectral range), and fast Fourier transform (FFT) coefficients A k and B k of transmitted light intensity.
Fig. 3. Measured absorption function of CO and the best fits of Voigt and Rautian profile (X CO, c , τ , and σ SD represent the CO concentration, light velocity, ring down time and standard deviation of the residual, respectively): (a) WM-DAS; (b) CW-CRDS.
Fig. 4. Measured spectral parameters for various pressures (WM-DAS (red), CW-CRDS (black)): (a) γ c (dot); (b) β (square), γ 2 (triangle).
Fig. 5. Allan variance measured by the two methods.
| |||||||||||||||||||||||||||||||||||||||||||||||||||||||||||||||||||||||||||||||||||||||||||||||||||||||||||||||||||||||||||||||||||||||||||||||||||||||||||||||||||||||||||||||||||||||||||||||||||||||||||||||||||||||||||||||||||||||||||||||||||||||||||||||||||||||||||||||||||||||||||||||||||||||||||||||||||||||||
Table 1. Measured spectroscopic parameters and uncertainties.

Set citation alerts for the article
Please enter your email address
© Copyright 2018-2021 | Chinese Laser Press. All Rights Reserved 沪ICP备15018463号-20