
Fei Liu, Shichao Zhang, Pingli Han, Fangyi Chen, Lin Zhao, Yingying Fan, Xiaopeng Shao, "Depolarization index from Mueller matrix descatters imaging in turbid water," Chin. Opt. Lett. 20, 022601 (2022)
- Chinese Optics Letters
- Vol. 20, Issue 2, 022601 (2022)
Abstract
1. Introduction
There have been growing interests in imaging for underwater detection, marine rescue, and aquaculture[
The Mueller matrix is mainly exploited and used in biomedical studies benefitting from its distinctive advantages of high-contrast imaging and abundant structure information[
In this Letter, a polarization descattering imaging method was proposed using a Mueller matrix for clear vision in turbid water. It first exploited the Mueller matrix of waterbody for a Dep, which characterizes how and to what extent the waterbody depolarizes light. Dep, combined with an optimal function, is then used to estimate the transmittance map, which enables quantification of light attenuation in water. The proposed method seeks only scattering information and does not depend on target information and DoP of the medium and target that is needed.
Sign up for Chinese Optics Letters TOC. Get the latest issue of Chinese Optics Letters delivered right to you!Sign up now
2. Methods and Results
According to the Jaffe–McGlamery imaging model[
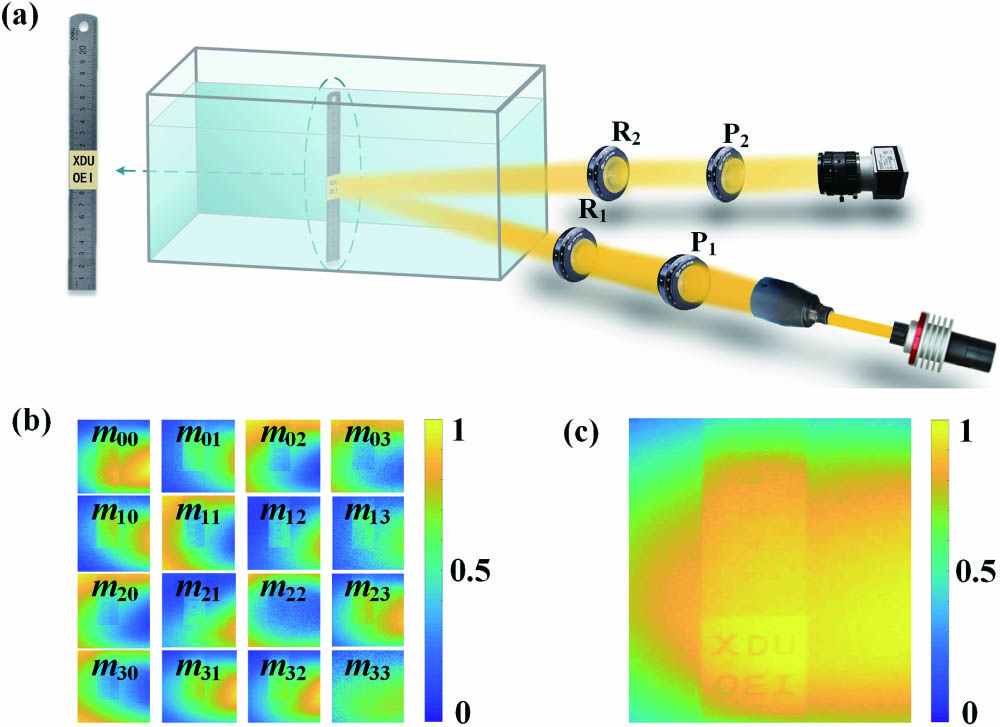
The Mueller matrix is measured by employing the dual-rotating-retarder method, where two polarizers (LPVISE200-A, Thorlabs) were used, and two achromatic quarter-wave plates (AQWP10M-580, Thorlabs) were mounted on a motorized rotation state (PRM1/MZ8, Thorlabs). Figure 1(a) presents the experiment setup, where illumination is obliquely incident on the target. We dissolved skimmed milk in 100 L tap water to mimic scattering conditions in turbid water in a
![]()
Figure 1.(a) Experiment setup of the proposed method. P1, P2 are polarizers, and R1, R2 are retarders. (b) and (c) 4 × 4 Mueller matrix and Dep index images in the water with a 45 NTU turbidity.
Figures 2(a)–2(d) are the four measured images detected in water with a 30.0 nephelometric turbidity units (NTU), 36.2 NTU, 41.0 NTU, and 50.0 NTU turbidity, respectively. The visibility obviously deteriorated with the turbidity increase. The backscattering intensity is denoted by grayscale values extracted from regions where there is no target. The four colored lines in Fig. 2(e) illustrate backscattering variation. It gets stronger and more uneven with turbidity increasing, and the calculated grayscale values of the Dep index by Eq. (2) are also presented in Fig. 2(e). It also gets stronger under higher turbidity, indicating stronger depolarizing conditions to light. However, Dep is more robust to location than to backscattering, not sensitive to objects and uneven illumination. It is determined only by the medium. Figures 3(b)–3(e) present the distribution of backscattering as a function of Dep in the selected area from images in Fig. 3(a):
![]()
Figure 2.(a)–(d) Intensity images in the water with 30.0 NTU, 36.2 NTU, 41.0 NTU, and 50.0 NTU turbidity, respectively; (e) intensity and Dep variation of (a)–(d) along the colored lines.
![]()
Figure 3.(a) Four measured m00(x, y) images at 30.0 NTU, 36.2 NTU, 41.0 NTU, and 50.0 NTU; (b)–(e) fitting results of backscattering intensity as a function of Dep values at 30.0 NTU, 36.2 NTU, 41.0 NTU, and 50.0 NTU, respectively.
For estimation of
Here, an image is divided into
Taking the experiment in 50.0 NTU turbidity water as an example, we show the captured intensity image and the reconstructed image in Figs. 4(a) and 4(b). The image contrast has been greatly improved after recovery. In particular, the paper stripe and metal ruler are simultaneously clearly visible. In the zoomed-in view of the region of interest in Figs. 4(c) and 4(d), the ruler in the intensity image presents a blurred appearance, especially the tick mark and edges. In contrast, after recovery, it is possible to distinguish the exact edges, and even tick marks on the ruler are clearly distinguishable. To quantify clarity improvement, Fig. 4(e) presents extracted details from Figs. 4(a) and 4(b), which is the intensity variation versus the vertical position 521 denoted by the vertical line passing through the Arabic numerals and alphabets. The recovered image provides an obviously intense intensity variation, indicating well-recovered target information and enhanced image contrast where backscattering is well-removed. This benefits from the fact that Dep enables accurate
![]()
Figure 4.(a) Intensity image; (b) recovered image with the proposed descattering method; (c) and (d) the zoomed-in view of the region of interest in (a) and (b) marked out with red rectangle; (e) the intensity value variations of (a) and (b) along the colored lines.
Further experiments were conducted under five different turbidities: 30.0 NTU, 36.2 NTU, 41.0 NTU, 45.2 NTU, and 50.0 NTU. Besides the ruler, another set of targets composed of two coins, copper-zinc alloys of 0.5 Chinese Yuan (CNY) and nickel alloys of 1 CNY, were tested and shown in Fig. 5. The raw intensity images in the two bottom rows all present an increasing veiling effect with increasing turbidity. However, all of the recovered images keep good vision. For the ruler, clearer details regarding the Arabic numerals as well as enhanced contrast are available after descattering. The two coins as well as their details are clearly visible in the recovered images, where image contrast is also enhanced. In addition, we employed UIQM to quantify image quality before (the dotted line) and after recovery (the full line), as presented by Fig. 5. UIQM works in a similar manner as a human observer, which comprises a sharpness measure (UISM) and a contrast measure (UIConM). It is worth noting that no matter how the water turbidity changes, the recovered images keep a significant improvement in image quality. There is a minor fluctuation in the quality of the reconstructed images. This mainly results from the polarization difference caused by water turbidity, even though the overall results are hardly affected. Besides, structural similarity (SSIM) is calculated with the recovered images at 30.0 NTU as reference. The developed method presents robustness to the turbidity increase. Therefore, the developed method is advantageous in robustness to water turbidity.
![]()
Figure 5.Experiment results of two sets of targets and evaluation data by UIQM and SSIM.
3. Conclusion
In conclusion, we proposed an underwater descattering method using the Mueller matrix to detect targets in multiple materials. It exploited the linear relationship between Dep derived from the Mueller matrix and backscattering intensity. An optimal function was introduced to estimate the transmittance map and then recover clear underwater vision. Experimental results show that the method can assist in detecting targets in multiple materials in turbid underwater. It also may inspire new underwater imaging strategies and has potential to be applied to underwater detection.
References
[1] X. Wang, H. Liu, M. Chen, Z. Liu, S. Han. Imaging through dynamic scattering media with stitched speckle patterns. Chin. Opt. Lett., 18, 042604(2020).
[2] F. Liu, Y. Wei, P. Han, K. Yang, L. Bai, X. Shao. Polarization-based exploration for clear underwater vision in natural illumination. Opt. Express, 27, 3629(2019).
[3] P. Han, F. Liu, Y. Wei, X. Shao. Optical correlation assists to enhance underwater polarization imaging performance. Opt. Laser Eng., 134, 106256(2020).
[4] S. Yoon, M. Kim, M. Jang, Y. Choi, W. Choi, S. Kang, W. Choi. Deep optical imaging within complex scattering media. Nat. Rev. Phys., 2, 141(2020).
[5] K. Liu, Y. Liang. Underwater image enhancement method based on adaptive attenuation-curve prior. Opt. Express, 29, 10321(2021).
[6] M. Wang, X. Wang, L. Sun, Y. Yang, Y. Zhou. Underwater 3D deblurring-gated range-intensity correlation imaging. Opt. Lett., 45, 1455(2020).
[7] W. Yi, H. Liu, P. Wang, M. Fu, J. Tan, X. Li. Reconstruction of target image from inhomogeneous degradations through backscattering medium images using self-calibration. Opt. Express, 25, 7329(2017).
[8] J. Jaffe. Enhanced extended range underwater imaging via structured illumination. Opt. Express, 18, 12328(2010).
[9] J. Jaffe. Underwater optical imaging: the past, the present, and the prospects. IEEE J. Oceanic Eng., 40, 683(2014).
[10] T. Treibitz, Y. Schechner. “Active polarization descattering. IEEE T. Pattern Anal., 31, 385(2009).
[11] M. Garcia, C. Edmiston, R. Marinov, A. Vail, V. Gruev. Bio-inspired color-polarization imager for real-time in situ imaging. Optica, 4, 1263(2017).
[12] F. Liu, P. Han, Y. Wei, K. Yang, S. Huang, X. Li, G. Zhang, L. Bai, X. Shao. Deeply seeing through highly turbid water by active polarization imaging. Opt. Lett., 43, 4903(2018).
[13] M. Kudenov, M. Escuti, N. Hagen, E. Dereniak, K. Oka. Snapshot imaging Mueller matrix polarimeter using polarization gratings. Opt. Lett., 37, 1367(2012).
[14] A. Tariq, H. He, P. Li, H. Ma. Purity-depolarization relations and the components of purity of a Mueller matrix. Opt. Express, 27, 22645(2019).
[15] K. Yan, S. Wang, S. Jiang, L. Xue, Y. Song, Z. Yan, Z. Li. Calculation and analysis of Mueller matrix in light scattering detection. Chin. Opt. Lett., 12, 092901(2014).
[16] G. Kattawar, D. Gray. Mueller matrix imaging of targets in turbid media: effect of the volume scattering function. Appl. Opt., 42, 7225(2003).
[17] A. Pierangelo, A. Benali, M. Antoneli, T. Novikova, P. Novikova, P. Validire, B. Gayet, A. Martino. Ex-vivo characterization of human colon cancer by Mueller polarimetric imaging. Opt. Express, 19, 1582(2011).
[18] Y. Dong, J. Qi, H. He, C. He, S. Liu, J. Wu, D. S. Elson, H. Ma. Quantitatively characterizing the microstructural features of breast ductal carcinoma tissues in different progression stages by Mueller matrix microscope. Biomed. Opt. Express, 8, 3643(2017).
[19] C. He, H. He, J. Chang, Y. Dong, S. Liu, N. Zeng, Y. He, H. Ma. Characterizing microstructures of cancerous tissues using multispectral transformed Mueller matrix polarization parameters. Biomed. Opt. Express, 6, 2934(2015).
[20] J. Jaffe. Computer modeling and the design of optimal underwater imaging systems. IEEE J. Oceanic Eng., 15, 101(1990).
[21] T. Treibitz, Y. Schechner. “Active polarization descattering. IEEE T. Pattern Anal., 3, 385(2008).
[22] K. Amer, M. Elbouz, A. Alfalou, C. Brosseau, J. Hajjami. Enhancing underwater optical imaging by using a low-pass polarization filter. Opt. Express, 27, 621(2019).
[23] R. Chipman. Depolarization index and the average degree of polarization. Appl. Opt., 44, 2490(2005).
[24] K. Panetta, C. Gao, S. Agaian. Human-visual-system-inspired underwater image quality measures. IEEE J. Oceanic Eng., 41, 541(2016).


Set citation alerts for the article
Please enter your email address

© Copyright 2018-2021 | Chinese Laser Press. All Rights Reserved 沪ICP备15018463号-20