
Xian-Yu Zhao, Xing-Hua Qu, Jia-Wei Chen, Ji-Hui Zheng, Jin-Dong Wang, Fu-Min Zhang. Method of measuring absolute distance based on spectral interferometry using an electro-optic comb [J]. Acta Physica Sinica, 2020, 69(9): 090601-1
- Acta Physica Sinica
- Vol. 69, Issue 9, 090601-1 (2020)
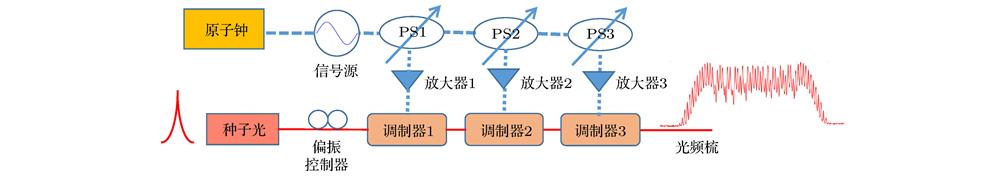
Fig. 1. Schematic setup of the electro-optic (EO) comb generation (PS, phase shifter).
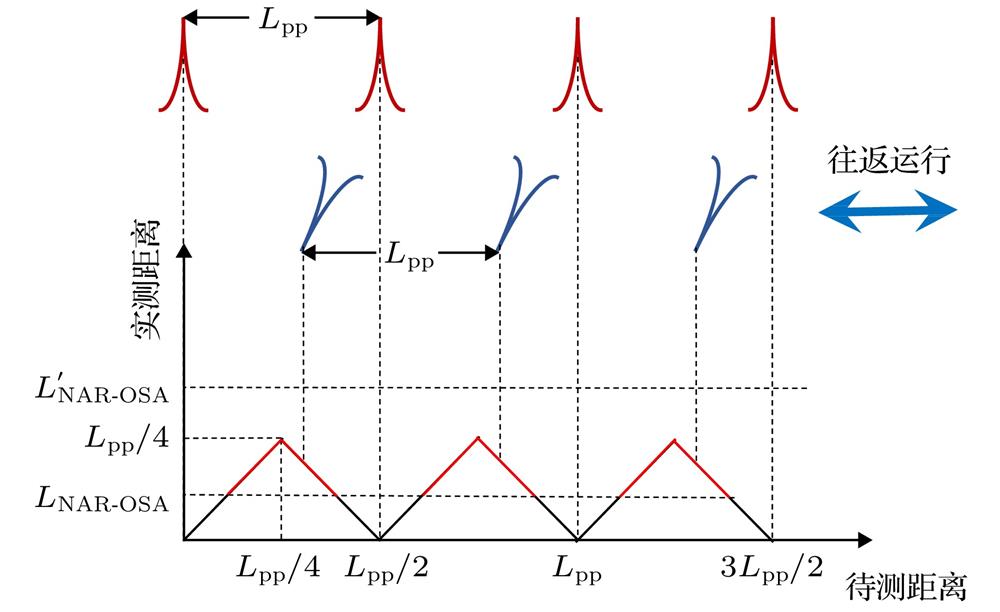
Fig. 2. Schematic diagram of the non-ambiguous range of spectral interference ranging.
Fig. 3. Schematic diagram of equal frequency interval resampling: (a) Signal obtained by spectrometer with equal wavelength interval sampling; (b) the signal after wavelength-frequency transformed; (c) the signal after linear coordinate transformation on the abscissa; (d) the signal after equal frequency interval resampling.
Fig. 4. Experimental setup of EO comb dispersion interferometry (BS, beam splitter; EDFA, erbium doped fiber amplifier).
Fig. 5. The spectrum of EO comb: (a) The spectrum of EO comb generated by cascaded EO modulators; (b) the EO comb spectrum after spectrum expansion; (c) the EO comb spectrum after band elimination filter.
Fig. 6. Spectral interferogram of reference arm and measuring arm at a relative position of (a) 0.3 mm, (b) 0.5 mm, (c) 1 mm, (d) 2 mm.
Fig. 7. Data processing of equal frequency interval resampling. (a) Spectral interferogram processed by peak seeking algorithm; (b) spectrum interferogram after the abscissa is converted into frequency; (c) Fourier transform of panel (a); (d) Fourier transform of panel (b).
Fig. 8. Peak position fitting according to quadratic equation. The inset is an enlargement of the pulse and the fitted curve.
Fig. 9. Experimental results of spectral interferometry in a non-ambiguous range.
Fig. 10. Experimental results of spectral interferometry beyond serial non-ambiguous ranges.

Set citation alerts for the article
Please enter your email address
© Copyright 2018-2021 | Chinese Laser Press. All Rights Reserved 沪ICP备15018463号-20