
Xiang Li, Yong Chen, Hao Feng, Lei Qi. Axially-distributed bubble-bubble interaction under a coustic excitation in pipeline [J]. Acta Physica Sinica, 2020, 69(18): 184703-1
- Acta Physica Sinica
- Vol. 69, Issue 18, 184703-1 (2020)
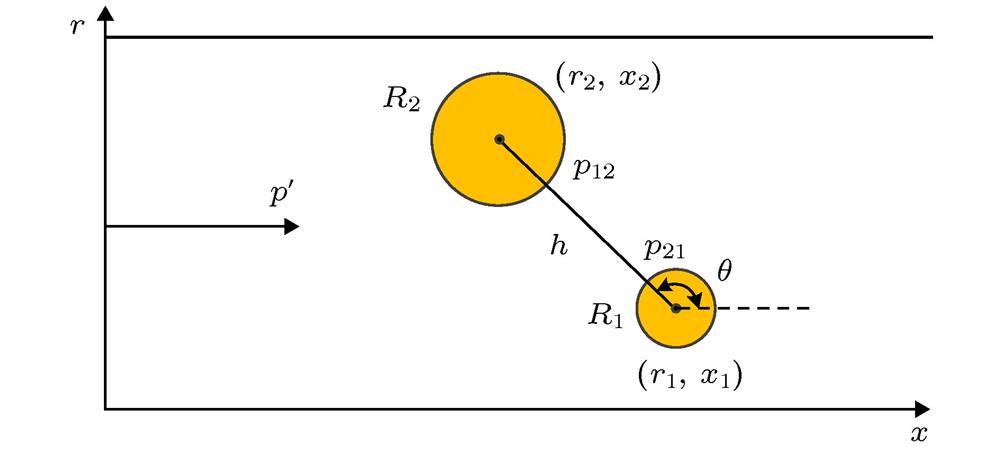
Fig. 1. Schematic diagram of two-bubble positions in the pipeline (two-dimensional).
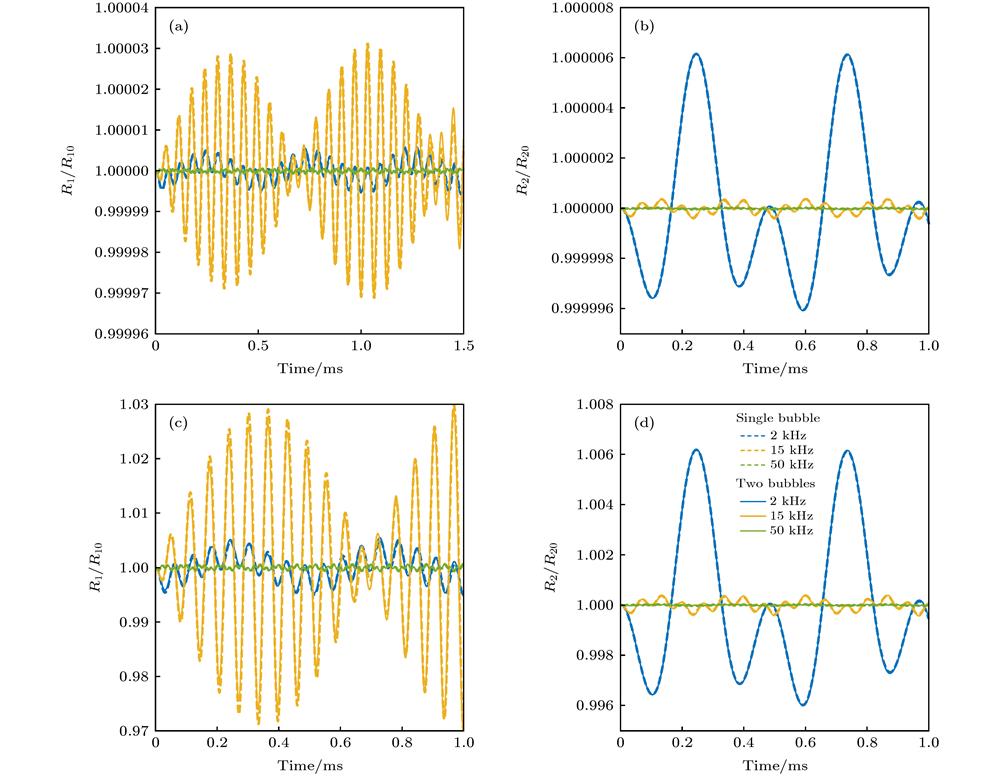
Fig. 2. Effects of acoustic excitations with different frequencies (2, 15 and 50 kHz) and amplitudes (1 Pa and 1 kPa) on the bubble dynamics under single free and regulated two-bubble vibrations: (a) Relative radius of bubble 1 between two configurations (single free and regulated two-bubble vibrations) with the amplitude of acoustic excitation being 1 Pa; (b) relative radius of bubble 2 between two configurations (single free and regulated two-bubble vibrations) with the amplitude of acoustic excitation being 1 Pa; (c) relative radius of bubble 1 between two configurations (single free and regulated two-bubble vibrations) with the amplitude of acoustic excitation being 1 kPa; (d) relative radius of bubble 2 between two configurations (single free and regulated two-bubble vibrations) with the amplitude of acoustic excitation being 1 kPa. The figure legend is given in panel (d).
Fig. 3. Effects of acoustic excitations with different frequencies (2, 15 and 50 kHz) and amplitudes (1 Pa and 1 kPa) on the bubble dynamics under different distances, with 2 mm and 8 mm, between the two bubbles: (a) Relative radius of bubble 1 under two different bubble’s distance with the amplitude of acoustic excitation being 1 Pa; (b) relative radius of bubble 2 under two different bubble’s distance with the amplitude of acoustic excitation being 1 Pa; (c) relative radius of bubble 1 under two different bubble’s distance with the amplitude of acoustic excitation being 1 kPa; (d) relative radius of bubble 2 under two different bubble’s distance with the amplitude of acoustic excitation being 1 kPa. The figure legend is given in panel (a) and (c).
Fig. 4. Effects of acoustic excitations with different frequencies (2, 15 and 50 kHz) and amplitudes (1 Pa and 1 kPa) on the second Bjerknes force under different distances, with 2 mm and 8 mm, between the two bubbles: (a) Relative radius of bubble 1 under two different bubble’s distance with the amplitude of acoustic excitation being 1 Pa; (b) relative radius of bubble 2 under two different bubble’s distance with the amplitude of acoustic excitation being 1 Pa; (c) relative radius of bubble 1 under two different bubble’s distance with the amplitude of acoustic excitation being 1 kPa; (d) relative radius of bubble 2 under two different bubble’s distance with the amplitude of acoustic excitation being 1 kPa.
Fig. 5. Effects of different bubble locations on the bubble’s dynamics with the frequency of acoustic excitation being 2 kHz: (a) The radius dynamics of bubble 1 under three different locations; (b) the radius dynamics of bubble 2 under three different locations
Fig. 6. Effects of different bubble locations on the bubble’s dynamics with the frequency of acoustic excitation being 15 kHz: (a) The radius dynamics of bubble 1 under three different locations; (b) the radius dynamics of bubble 2 under three different locations.
Fig. 7. Effects of different bubble locations on the bubble’s dynamics with the frequency of acoustic excitation being 50 kHz: (a) The radius dynamics of bubble 1 under three different locations; (b) the radius dynamics of bubble 2 under three different locations.
Fig. 8. Amplitude-frequency response chart of bubble dynamics under pulse excitation: (a) Amplitude-frequency response chart of free single bubble system; (b) amplitude-frequency response chart of two-bubble coupled system with bubble distance being 8 mm.
Fig. 9. Amplitude-frequency response chart of nonlinear two-bubble dynamics under pulse excitation.


Set citation alerts for the article
Please enter your email address

© Copyright 2018-2021 | Chinese Laser Press. All Rights Reserved 沪ICP备15018463号-20