• Chinese Physics B
  • Vol. 29, Issue 8, (2020)
Qi Hao1, Ji-Chao Qiao1、†, E V Goncharova2, G V Afonin2, Min-Na Liu1, Yi-Ting Cheng1, and V A Khonik2
Author Affiliations
  • 1School of Mechanics, Civil Engineering and Architecture, Northwestern Polytechnical University, Xi’an 70072, China
  • 2Department of General Physics, Voronezh State Pedagogical University, Lenin Street 86, Voronezh 394043, Russia
  • show less
    DOI: 10.1088/1674-1056/ab969c Cite this Article
    Qi Hao, Ji-Chao Qiao, E V Goncharova, G V Afonin, Min-Na Liu, Yi-Ting Cheng, V A Khonik. Thermal effects and evolution of the defect concentration based on shear modulus relaxation data in a Zr-based metallic glass[J]. Chinese Physics B, 2020, 29(8): Copy Citation Text show less
    The heat flows for the initial and relaxed samples after the subtraction of the heat flow for the fully crystallized state (labelled (difference between runs 1 and 3) and (difference between runs 2 and 3), respectively). The inset shows DSC curves of the Zr48(Cu5/6Ag1/6)44Al8 bulk metallic glass in the initial state (run 1), relaxed state obtained by preheating up to 715 K (run 2) and after the full crystallization (run 3).
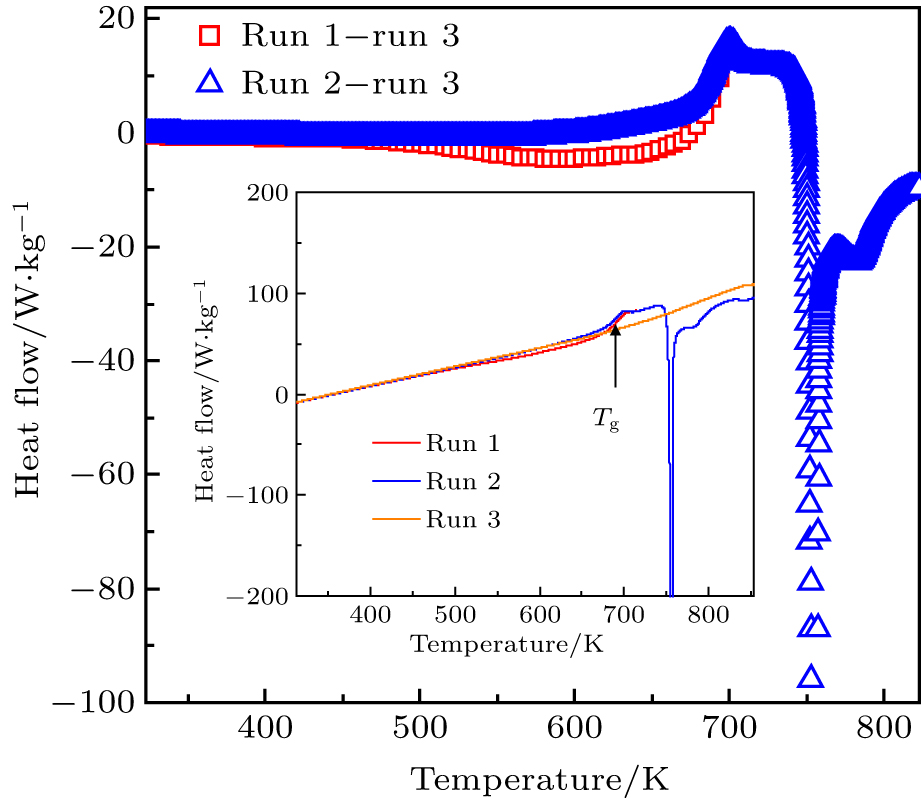
    Fig. 1. The heat flows for the initial and relaxed samples after the subtraction of the heat flow for the fully crystallized state (labelled (difference between runs 1 and 3) and (difference between runs 2 and 3), respectively). The inset shows DSC curves of the Zr48(Cu5/6Ag1/6)44Al8 bulk metallic glass in the initial state (run 1), relaxed state obtained by preheating up to 715 K (run 2) and after the full crystallization (run 3).
    Temperature dependence of the shear modulus of Zr48(Cu5/6Ag1/6)44Al8 bulk metallic glass in the initial, relaxed and crystalline states measured at a heating rate of 3 K/min. The black solid and dashed curves are calculated using Eq. (3), in good agreement with the experimental data.
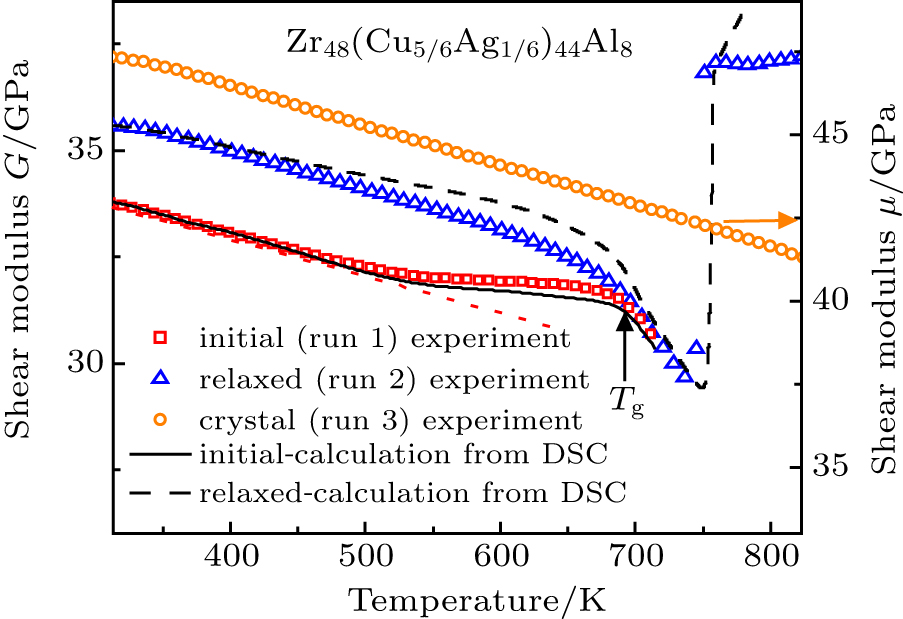
    Fig. 2. Temperature dependence of the shear modulus of Zr48(Cu5/6Ag1/6)44Al8 bulk metallic glass in the initial, relaxed and crystalline states measured at a heating rate of 3 K/min. The black solid and dashed curves are calculated using Eq. (3), in good agreement with the experimental data.
    Temperature dependence of the derivative d ln (μ / G) / dT for the initial (red squares) and relaxed states (blue triangles). Positive and negative values of this derivative correspond to an increase and decrease of the defect concentration, respectively, as implied by Eq. (4). This is directly seen when compared with the inset, which shows temperature dependences of the defect concentration in the initial and relaxed states calculated using Eq. (5), see the text for more details.
    Fig. 3. Temperature dependence of the derivative d ln (μ / G) / dT for the initial (red squares) and relaxed states (blue triangles). Positive and negative values of this derivative correspond to an increase and decrease of the defect concentration, respectively, as implied by Eq. (4). This is directly seen when compared with the inset, which shows temperature dependences of the defect concentration in the initial and relaxed states calculated using Eq. (5), see the text for more details.
    Qi Hao, Ji-Chao Qiao, E V Goncharova, G V Afonin, Min-Na Liu, Yi-Ting Cheng, V A Khonik. Thermal effects and evolution of the defect concentration based on shear modulus relaxation data in a Zr-based metallic glass[J]. Chinese Physics B, 2020, 29(8):
    Download Citation