• Journal of Atmospheric and Environmental Optics
  • Vol. 18, Issue 3, 227 (2023)
WANG Lijun*, ZHOU Yu, WAN Lijuan, and CHENG Liangliang
Author Affiliations
  • School of Electronic Information and Electrical Engineering, Hefei Normal University, Hefei 230601, China
  • show less
    DOI: 10.3969/j.issn.1673-6141.2023.03.004 Cite this Article
    Lijun WANG, Yu ZHOU, Lijuan WAN, Liangliang CHENG. Application of the Bayesian-based big data model in the analysis of the source of air pollution[J]. Journal of Atmospheric and Environmental Optics, 2023, 18(3): 227 Copy Citation Text show less
    8 main influence factors to PM2.5 and their interrelation scatter matrix
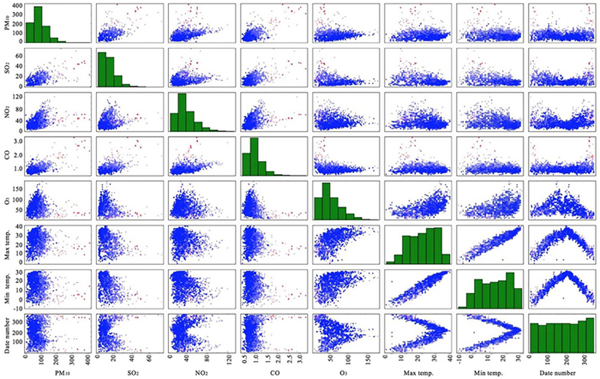
    Fig. 1. 8 main influence factors to PM2.5 and their interrelation scatter matrix
    Distribution of PM2.5 air pollution in Hefei from 2013 to 2018
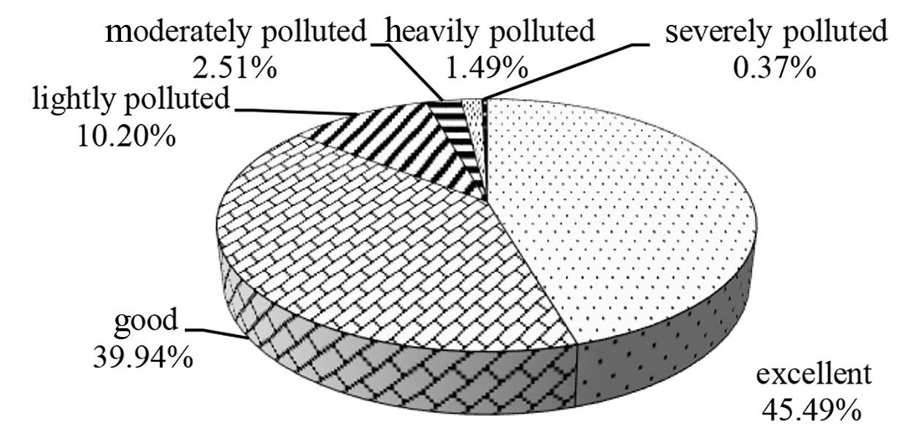
    Fig. 2. Distribution of PM2.5 air pollution in Hefei from 2013 to 2018

    PM10

    concentration/(µg·m-3)

    SO2

    concentration/(µg·m-3)

    NO2

    concentration/(µg·m-3)

    CO

    concentration/(µg·m-3)

    O3

    concentration/(µg·m-3)

    Max temp./℃Min temp./℃Date number

    PM2.5

    level

    20037441.354224112983
    24738551.584624152993
    8816270.874621153002
    5515351.082518153012
    Table 1. Data collection table for weather and air quality of Hefei City from 2013 to 2018

    PM2.5

    pollution level

    Number of daysCorrectly recognized days

    Recognition

    rate/%

    037636396.54
    114112588.65
    2382976.32
    35360.00
    42150.00
    Table 2. Analysis results of PM2.5 pollution model in Hefei City

    PM2.5

    pollution level

    01234
    00.9700.1600
    10.030.890.030.400
    200.090.760.000.50
    300.020.030.600
    4000.0200.50
    Table 3. Confusion matrix for model analysis results
    PM2.5 pollution levelPM10SO2NO2COO3Max temp.Min temp.Date number
    5 (Severely polluted)0.5160.0670.1710.481-0.9910.0960.270-0.115
    4 (Heavily polluted)0.2340.173-0.3020.371-1.417-0.0260.211-0.050
    3 (Moderated polluted)0.2620.137-0.2470.375-1.3320.0140.257-0.068
    2 (Lightly polluted)0.4371.085-0.1240.0970.157-0.256-0.5800.234
    Table 4. Main influence factors to PM2.5 pollution and their partial derivatives of Mahalanobis distance
    Lijun WANG, Yu ZHOU, Lijuan WAN, Liangliang CHENG. Application of the Bayesian-based big data model in the analysis of the source of air pollution[J]. Journal of Atmospheric and Environmental Optics, 2023, 18(3): 227
    Download Citation