• Acta Physica Sinica
  • Vol. 69, Issue 9, 098201-1 (2020)
Zhong-Qiang Zhang1、*, Fan-Shun Yu1, Zhen Liu2、3, Fu-Jian Zhang1, and Guang-Gui Cheng1
Author Affiliations
  • 1Institute of Intelligent Flexible Mechatronics, Jiangsu University, Zhenjiang 212013, China
  • 2School of Naval Architecture and Ocean Engineering, Jiangsu University of Science and Technology, Zhenjiang 212003, China
  • 3State Key Laboratory of Coastal and Offshore Engineering, Dalian University of Technology, Dalian 116024, China
  • show less
    DOI: 10.7498/aps.69.20191761 Cite this Article
    Zhong-Qiang Zhang, Fan-Shun Yu, Zhen Liu, Fu-Jian Zhang, Guang-Gui Cheng. Reverse osmotic characteristics and mechanism of hydrogenated porous graphene[J]. Acta Physica Sinica, 2020, 69(9): 098201-1 Copy Citation Text show less
    (a) Molecular dynamics model for pressure-driven reverse osmosis by a hydrogenated porous graphene. The dark gray particles are carbon atoms of grapheme. The red, white, purple, and green spheres represent the oxygen atoms, hydrogen atoms, sodium ions, and chloride ions in the brine, respectively. The monolayer graphene at the left side is used to provide driving pressure, while the one at the right side is rigid boundary to confine the solvent. (b) A hydrogenated porous graphene reverse osmosis membrane model. The white and yellow particles are hydrogen and carbon atoms with the same positive and negative charges, respec-tively.
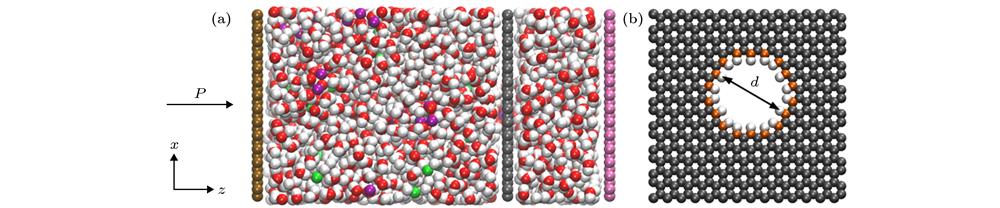
    Fig. 1. (a) Molecular dynamics model for pressure-driven reverse osmosis by a hydrogenated porous graphene. The dark gray particles are carbon atoms of grapheme. The red, white, purple, and green spheres represent the oxygen atoms, hydrogen atoms, sodium ions, and chloride ions in the brine, respectively. The monolayer graphene at the left side is used to provide driving pressure, while the one at the right side is rigid boundary to confine the solvent. (b) A hydrogenated porous graphene reverse osmosis membrane model. The white and yellow particles are hydrogen and carbon atoms with the same positive and negative charges, respec-tively.
    Salt rejection versus water permeability for the porous grapheme with pore diameter of 1.2 nm under different pressure, temperature and shearing speed conditions.
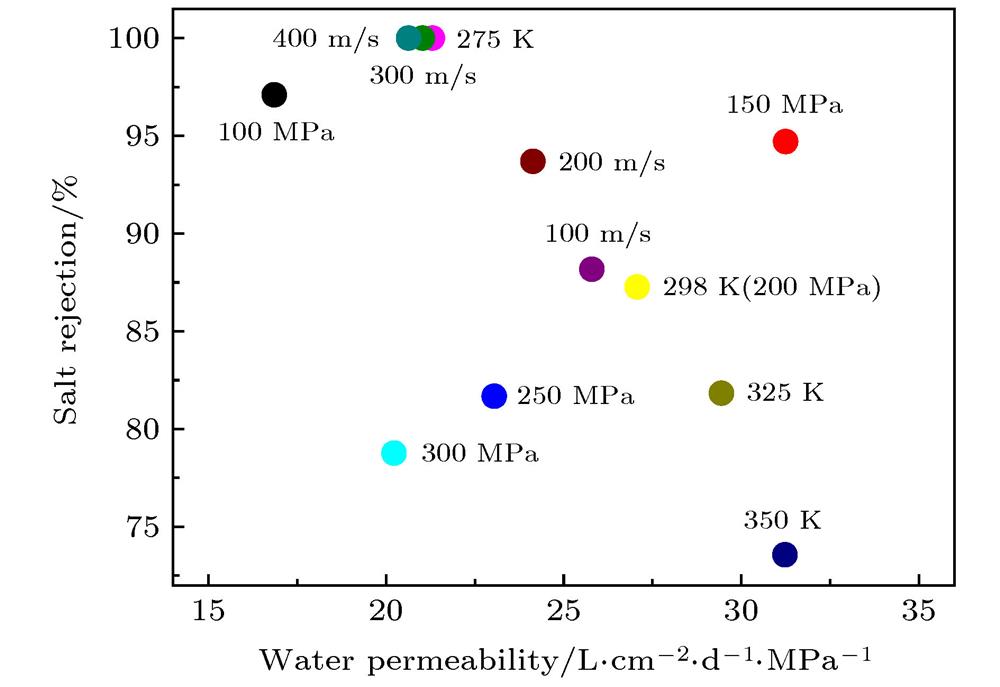
    Fig. 2. Salt rejection versus water permeability for the porous grapheme with pore diameter of 1.2 nm under different pressure, temperature and shearing speed conditions.
    (a) Proportion ratio of salt ions in the brine zone to the total salt ion in the range of 1 nm of the membrane; (b) the z-directional distribution of hydrogen bonds (HB) and velocity in brine zone when the shearing speed is 400 m/s.
    Fig. 3. (a) Proportion ratio of salt ions in the brine zone to the total salt ion in the range of 1 nm of the membrane; (b) the z-directional distribution of hydrogen bonds (HB) and velocity in brine zone when the shearing speed is 400 m/s.
    The z-directional distribution relationship between the number of hydrogen bonds per water molecule and the number of port water molecules and their hydrogen bond average in the feed solution: (a) Different shearing speeds; (b) different temperatures.
    Fig. 4. The z-directional distribution relationship between the number of hydrogen bonds per water molecule and the number of port water molecules and their hydrogen bond average in the feed solution: (a) Different shearing speeds; (b) different temperatures.
    (a) The PMF of water molecules along the z-axis at different temperatures for the membrane without shearing; (b) the PMF of water molecules along the z-axis for different shear speeds. The driving pressure in feed solution is 200 MPa.
    Fig. 5. (a) The PMF of water molecules along the z-axis at different temperatures for the membrane without shearing; (b) the PMF of water molecules along the z-axis for different shear speeds. The driving pressure in feed solution is 200 MPa.
    (a) Radial distribution function G(r) of water molecules and salt ions under different driving pressures; (b) radial distri-bution function G(r) of water molecules and salt ions at different temperatures.
    Fig. 6. (a) Radial distribution function G(r) of water molecules and salt ions under different driving pressures; (b) radial distri-bution function G(r) of water molecules and salt ions at different temperatures.
    (a) Hydration state diagram at different temperatures; (b) hydration state diagram at different shear velocities. Black square: The number of water molecules in first hydration shell. Red square: HB in first hydration shell. Blue square: The number of water molecules in second hydration shell. Purple square: HB in second hydration shell.
    Fig. 7. (a) Hydration state diagram at different temperatures; (b) hydration state diagram at different shear velocities. Black square: The number of water molecules in first hydration shell. Red square: HB in first hydration shell. Blue square: The number of water molecules in second hydration shell. Purple square: HB in second hydration shell.
    (a) Salt rejection versus water permeability for pore diameter of 1.6 nm under different conditions of pressure, temperature and speed; (b) water permeability as a function of driving pressure for the pore diameter of 0.82 nm at the temperature of 298 K and the shearing speed of 0.
    Fig. 8. (a) Salt rejection versus water permeability for pore diameter of 1.6 nm under different conditions of pressure, temperature and speed; (b) water permeability as a function of driving pressure for the pore diameter of 0.82 nm at the temperature of 298 K and the shearing speed of 0.
    ElementsC (sp2) CCHHCHOwHwNa+Cl
    ε/kcal·mol–10.08590.0460.03010.1627500.16840117
    σ3.39972.9852.423.1643502.25895.1645
    q/e 0–0.1150.115–1.04840.52521–1
    Table 1. LJ potential parameters.
    τ = 200 MPa, v = 0 T = 298 K, v = 0 T = 298 K, τ = 200 MPa
    T/K τ/MPa v/m·s–1
    275298325350100150250300100200300400
    Q0.720.840.870.880.760.970.870.780.880.830.840.83
    Table 2. Trade-offs between selectivity and permeability with pore diameter of 1.2 nm.
    τ = 200 MPa, v = 0 T = 298 K, v = 0 T = 298 K, τ = 200 MPa
    T/K τ/MPa v/m·s–1
    275298325350100150250300100200300400
    Q0.650.730.700.690.960.850.660.610.630.650.600.60
    Table 3. Trade-offs between selectivity and permeability with pore diameter of 1.6 nm.
    Zhong-Qiang Zhang, Fan-Shun Yu, Zhen Liu, Fu-Jian Zhang, Guang-Gui Cheng. Reverse osmotic characteristics and mechanism of hydrogenated porous graphene[J]. Acta Physica Sinica, 2020, 69(9): 098201-1
    Download Citation