
Zhang Yueying, Ni Chenyin, Shen Zhonghua. Laser Ultrasonic Monitoring of Reversible/Irreversible Changes in Photo-Thermal Modulation Crack Closure[J]. Chinese Journal of Lasers, 2020, 47(12): 1204006
- Chinese Journal of Lasers
- Vol. 47, Issue 12, 1204006 (2020)
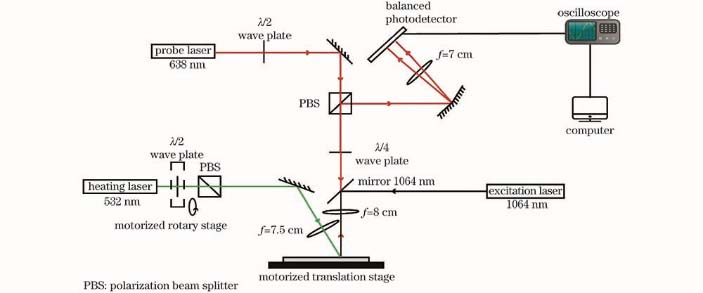
Fig. 1. Schematic of experimental setup
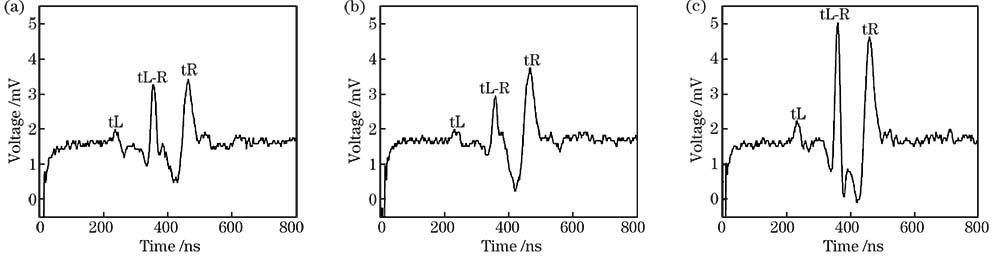
Fig. 2. Time domain waveforms based on TOFD method in three areas of crack. (a) Start of crack; (b) middle of crack; (c) tip of crack
Fig. 3. Schematic of sound wave transmission at surface of crack
Fig. 4. Schematic of excitation-detection source scanning path
Fig. 5. Schematic of location of crack heating area
Fig. 6. Scanning results of tR(heat) peak-peak value when cracks are heated in three photo-thermal cycles. (a) 1st photo-thermal cycle; (b) 2nd photo-thermal cycle; (c) 3rd photo-thermal cycle
Fig. 7. Scanning results of tL-R(heat) peak-peak value when cracks are heated in three photo-thermal cycles. (a) 1st photo-thermal cycle; (b) 2nd photo-thermal cycle; (c) 3rd photo-thermal cycle
Fig. 8. Scanning results of arrival time of tR(heat) signal when crack are heated in first photo-thermal cycle. (a) Area 1; (b) area 2; (c) area 3
Fig. 9. Curves of average peak-peak value of tR(heat) when cracks are heated. (a) Area 1; (b) area 2; (c) area 3
Fig. 10. Curves of average peak-peak value of tL-R(heat) when cracks are heated. (a) Area 1; (b) area 2; (c) area 3
Fig. 11. Curve of average arrival time of tR(heat) when cracks are heated in first photo-thermal cycle
Fig. 12. Schematic of surface wave propagation path before crack heating in the first photo-thermal cycle. (a) Area 1; (b) area 2; (c) area 3

Set citation alerts for the article
Please enter your email address
© Copyright 2018-2021 | Chinese Laser Press. All Rights Reserved 沪ICP备15018463号-20