
Zhang Zhang, Ju Gao, Maosheng Yang, Xin Yan, Yuying Lu, Liang Wu, Jining Li, Dequan Wei, Longhai Liu, Jianhua Xie, Lanju Liang, Jianquan Yao, "Microfluidic integrated metamaterials for active terahertz photonics," Photonics Res. 7, 1400 (2019)
- Photonics Research
- Vol. 7, Issue 12, 1400 (2019)
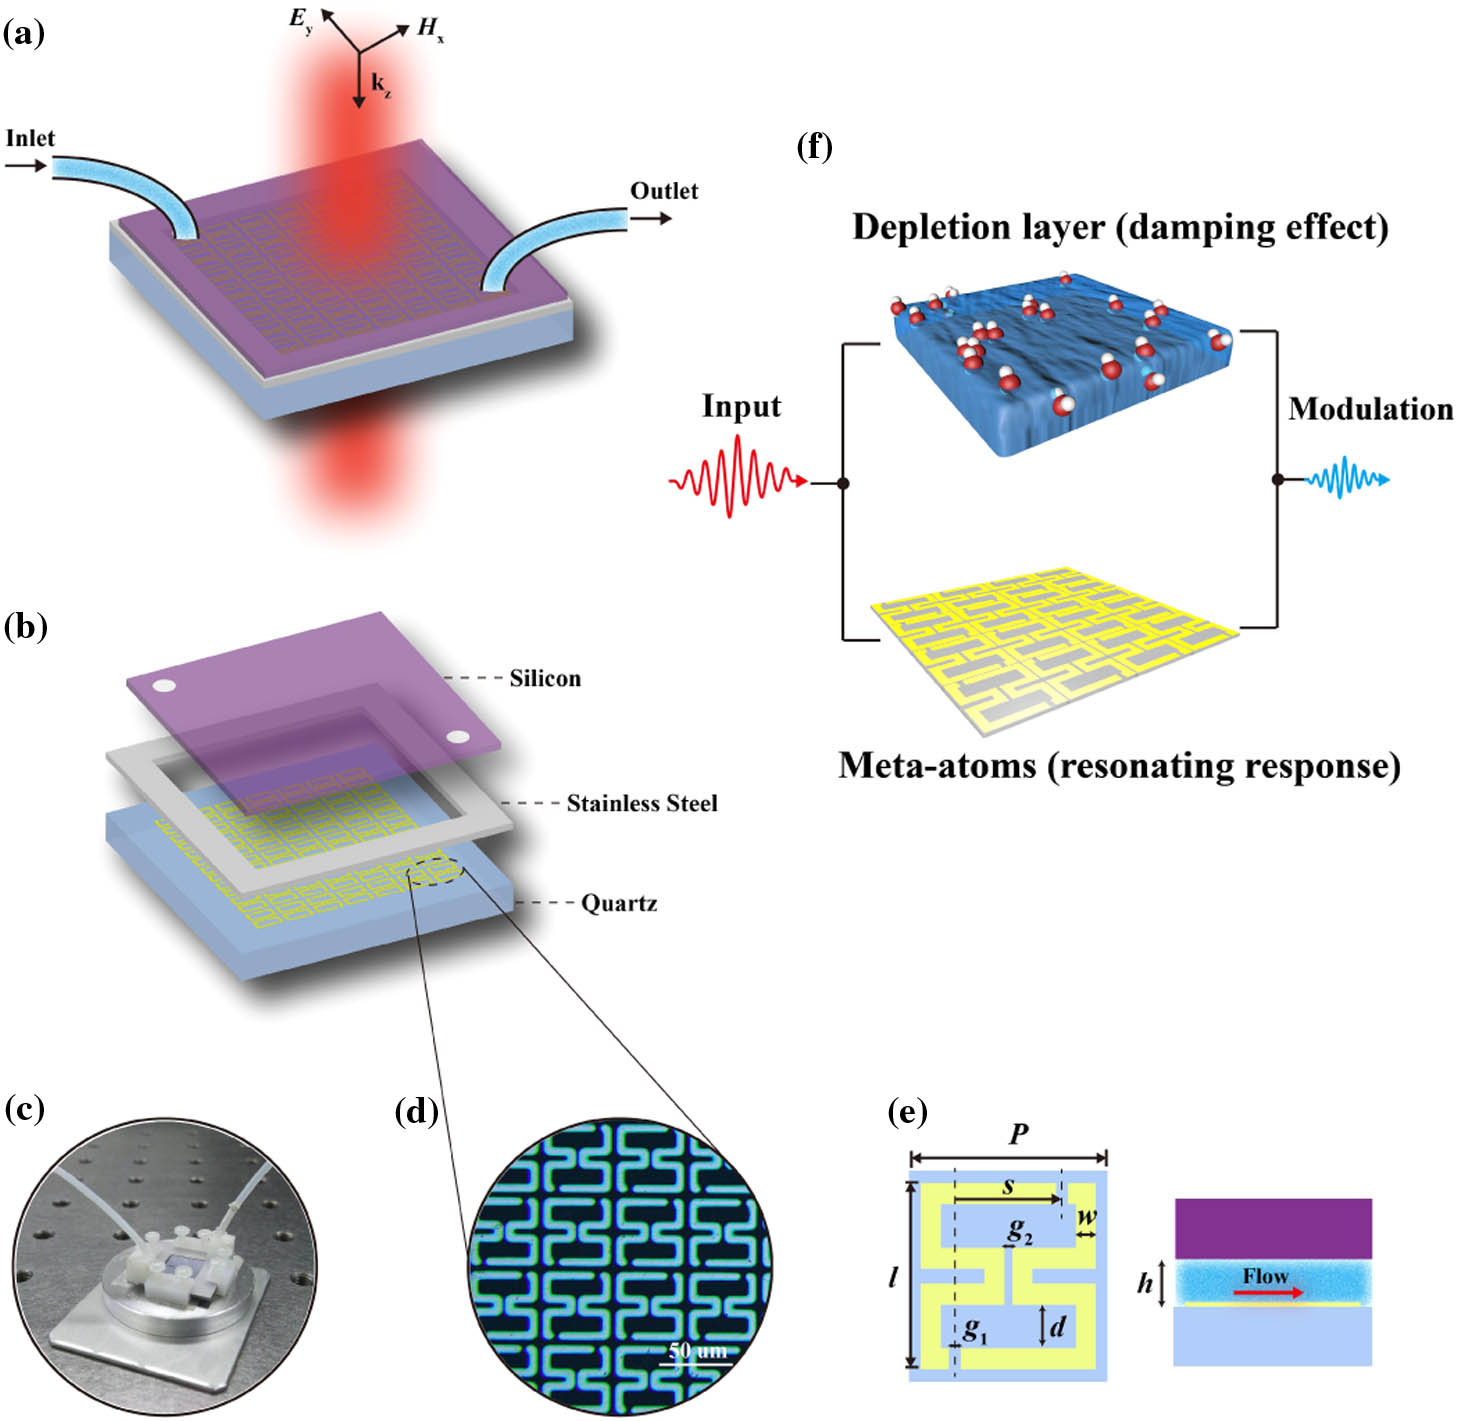
Fig. 1. (a) Schematic of MIMs platform with liquid flowing through from the inlet to the outlet under the irradiation of E y P = 48 μm l = 44 μm w = 5 μm d = 10.25 μm g 1 = 3 μm g 2 = 2 μm s = 27 μm h = 35 μm

Fig. 2. Schematic of THz–TDS measurement system. Photograph of micropumping system is shown as inset.
Fig. 3. (a) Measured THz transmission spectra for the MIMs sample showing the modulation of resonant peaks with varying water content from 0% to 100%; (b) corresponding simulation spectra, whereby the increasing water content levels are represented by an increasing water-layer thickness together with the enhancement of IPA-layer permittivity. (c) Schematic illustration of simulated model, in which the water layer and IPA layer are created to simulate the water effect in reality; (d) parameters extracted from the coupled Lorentz oscillator model by fitting the experiments in the frequency range marked as gray in (a) under different water contents; (e) electric field monitored to SRRs under 0.2 and 2 μm water-layer thickness at three resonant peaks marked as I, II, and III in (b), respectively.
Fig. 4. (a)–(f) Electric field distribution of SRRs at 0.91, 1.18, 1.45, 2.21, 2.68, and 3 THz, respectively. (g)–(l) The corresponding surface currents density of SRRs at different frequencies; the red arrows represent the currents’ flowing direction.
Fig. 5. (a) Time-frequency joint analysis of MIMs transmission with IPA solution flowing through; (b) comparison of frequency spectrum obtained from CWT and FFT.
Fig. 6. (a)–(d) Joint time-frequency analysis of experimental extinction obtained from CWT at water content of (a) 0%, (b) 20%, (c) 60%, and (d) 100%. (e), (f) The dependences of extinction intensity and FWHM of Gaussian curve acquired at 2.21 THz on water content at (e) position 1 and (f) position 2 that have been marked in (a).
Fig. 7. (a)–(c) Dependence of measured transmission on frequency and water content in (a) IPA, (b) ethanol, and (c) acetone. (d)–(f) Dependence of measured phase shift on frequency and water content in (d) IPA, (e) ethanol, and (f) acetone. (g)–(i) Group delays under different water contents in (g) IPA, (h) ethanol, and (i) acetone. (j)–(l) Corresponding transmission and phase shift of three peaks labeled as peaks I, II, and III [as shown in Fig. 2(b) ] at different water contents in (j) IPA, (k) ethanol, and (l) acetone. (m) Histogram of modulation depth and phase difference of peaks I, II, and III in different organic liquids.
Fig. 8. Trace determination of water in IPA solution by using MIMs platforms. (a) Measured transmission of MIMs platform under the trace of water percentage increasing from 0% to 10%. (b) Enlarged version of gray region in (a); the difference of transmission is marked by dark dashed lines.


Set citation alerts for the article
Please enter your email address

© Copyright 2018-2021 | Chinese Laser Press. All Rights Reserved 沪ICP备15018463号-20