• High Power Laser Science and Engineering
  • Vol. 8, Issue 3, 03000e30 (2020)
Tinghao Liu1、2, Qiang Liu1、2, Zhan Sui3, Mali Gong1、2, and Xing Fu1、2、*
Author Affiliations
  • 1Key Laboratory of Photonic Control Technology (Tsinghua University), Ministry of Education, Beijing 100084, China
  • 2State Key Laboratory of Precision Measurement Technology and Instruments, Department of Precision Instrument, Tsinghua University, Beijing 100084, China
  • 3Shanghai Institute of Laser Plasma, China Academy of Engineering Physics, Shanghai 201800, China
  • show less
    DOI: 10.1017/hpl.2020.28 Cite this Article Set citation alerts
    Tinghao Liu, Qiang Liu, Zhan Sui, Mali Gong, Xing Fu. Spatiotemporal characterization of laser pulse amplification in double-pass active mirror geometry[J]. High Power Laser Science and Engineering, 2020, 8(3): 03000e30 Copy Citation Text show less
    Optical paths in a double-pass laser amplifier with a single AM. (a) Three-dimensional view; (b) two-dimensional view on the xz plane, along with the initial distribution of stored energy density.
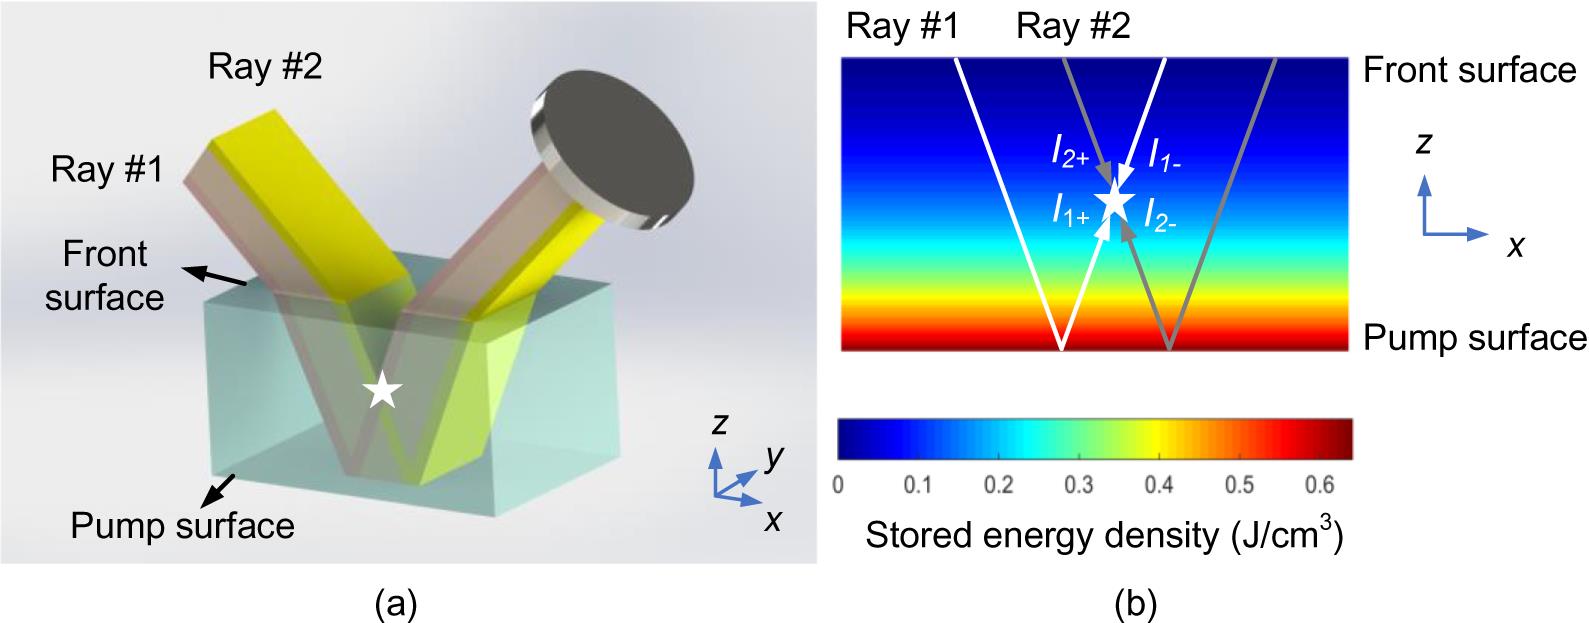
    Fig. 1. Optical paths in a double-pass laser amplifier with a single AM. (a) Three-dimensional view; (b) two-dimensional view on the xz plane, along with the initial distribution of stored energy density.
    Sequence diagrams of three types of overlap conditions. (a) C2PO; (b) N2PO; (c) 4PO.
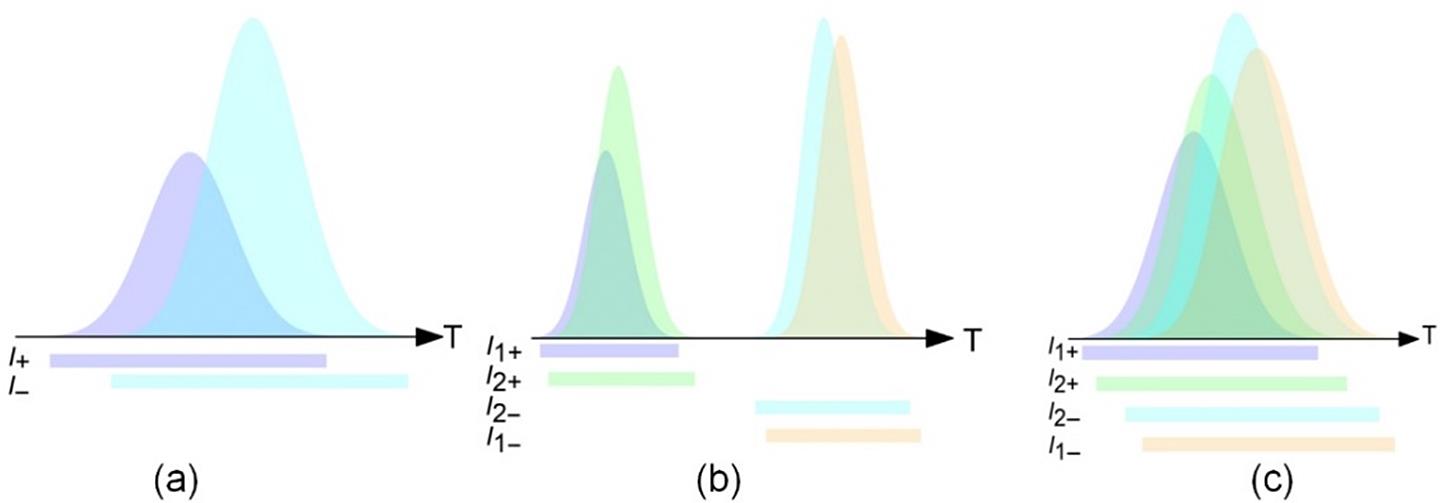
    Fig. 2. Sequence diagrams of three types of overlap conditions. (a) C2PO; (b) N2PO; (c) 4PO.
    Experimental layout of the double-pass AM amplifier. PBS, polarization beam splitter; BS, beam splitter; QWP, quarter-wave plate; HR, high-reflection mirror; EM, energy meter; PD, photodetector.
    Fig. 3. Experimental layout of the double-pass AM amplifier. PBS, polarization beam splitter; BS, beam splitter; QWP, quarter-wave plate; HR, high-reflection mirror; EM, energy meter; PD, photodetector.
    Instantaneous stored energy density and extracting beam intensity at M versus TOF. (a) Successive extraction with no overlap, considering a seed beam of zero temporal width; (b) C2PO; (c) N2PO; (d) 4PO.
    Fig. 4. Instantaneous stored energy density and extracting beam intensity at M versus TOF. (a) Successive extraction with no overlap, considering a seed beam of zero temporal width; (b) C2PO; (c) N2PO; (d) 4PO.
    Relationship between ΔEst and instantaneous overall beam intensity ∑ I at location M for the C2PO condition.
    Fig. 5. Relationship between ΔEst and instantaneous overall beam intensity ∑ I at location M for the C2PO condition.
    Instantaneous stored energy density at a given TOF in a double-pass amplifier with single AM.
    Fig. 6. Instantaneous stored energy density at a given TOF in a double-pass amplifier with single AM.
    (a) p-τ diagram for GWB; (b) gain window for four pulse segments (PS #1–#4 from rays #1, #2) that participate in the same 4PO process at TOF of 25.5 ns; (c) p-τ diagram of GWF. The colorbar setting is the same as that for Figure 6.
    Fig. 7. (a) p-τ diagram for GWB; (b) gain window for four pulse segments (PS #1–#4 from rays #1, #2) that participate in the same 4PO process at TOF of 25.5 ns; (c) p-τ diagram of GWF. The colorbar setting is the same as that for Figure 6.
    Gain windows at different TOFs throughout the amplification. The colorbar setting is the same as that for Figure 6.
    Fig. 8. Gain windows at different TOFs throughout the amplification. The colorbar setting is the same as that for Figure 6.
    Pulse shape variation through the AM chain with D = 0.3 m. (a) Input energy of 0.1 J; (b) input energy of 1 J.
    Fig. 9. Pulse shape variation through the AM chain with D = 0.3 m. (a) Input energy of 0.1 J; (b) input energy of 1 J.
    Pulse shape for different D with an input energy of 1 J.
    Fig. 10. Pulse shape for different D with an input energy of 1 J.
    Measured pulse profiles under the 4PO condition, along with predicted results, versus different input energies. (a) 0.1 J; (b) 1 J; (c) 1.8 J; (d) 3 J.
    Fig. 11. Measured pulse profiles under the 4PO condition, along with predicted results, versus different input energies. (a) 0.1 J; (b) 1 J; (c) 1.8 J; (d) 3 J.
    Predicted and measured results for an amplified pulse profile under the N2PO condition versus input energy. (a) 0.1 J; (b) 1 J; (c) 1.8 J; (d) 3 J.
    Fig. 12. Predicted and measured results for an amplified pulse profile under the N2PO condition versus input energy. (a) 0.1 J; (b) 1 J; (c) 1.8 J; (d) 3 J.
    Transverse intensity profiles of amplified beam versus the input energy. (a) 0.1 J; (b) 1 J; (c) 1.8 J; (d) 3 J.
    Fig. 13. Transverse intensity profiles of amplified beam versus the input energy. (a) 0.1 J; (b) 1 J; (c) 1.8 J; (d) 3 J.
    RSD of transverse intensity distribution versus the input energy and D.
    Fig. 14. RSD of transverse intensity distribution versus the input energy and D.
    Energy-loss ratio of 4PO. (a) Versus ηop; (b) versus the input energy.
    Fig. 15. Energy-loss ratio of 4PO. (a) Versus ηop; (b) versus the input energy.
    Influence of the number of AMs in a chain on the laser output characteristics. (a) Pulse shape; (b) intensity distribution; (c) RSD of intensity distribution; (d) energy-loss ratio.
    Fig. 16. Influence of the number of AMs in a chain on the laser output characteristics. (a) Pulse shape; (b) intensity distribution; (c) RSD of intensity distribution; (d) energy-loss ratio.
    Evolution from an AM chain to zigzag geometry. (a) Four AM modules closely arranged; (b) zigzag geometry.
    Fig. 17. Evolution from an AM chain to zigzag geometry. (a) Four AM modules closely arranged; (b) zigzag geometry.
    Scaling factor (a) versus the ratio of H to H0 and (b) versus the input fluence.
    Fig. 18. Scaling factor (a) versus the ratio of H to H0 and (b) versus the input fluence.
    Influence of spatiotemporal overlap on the amplified zigzag output. (a) Energy-loss ratio versus D (BN = 4); (b) energy-loss ratio versus BN (D = 0 m); (c) pulse shape versus input energy (BN = 4); (d) pulse shape versus BN (input energy of 0.1 J); (e) pulse shape versus input energy (BN = 8); (f) RSD of intensity profile versus BN.
    Fig. 19. Influence of spatiotemporal overlap on the amplified zigzag output. (a) Energy-loss ratio versus D (BN = 4); (b) energy-loss ratio versus BN (D = 0 m); (c) pulse shape versus input energy (BN = 4); (d) pulse shape versus BN (input energy of 0.1 J); (e) pulse shape versus input energy (BN = 8); (f) RSD of intensity profile versus BN.
    Tinghao Liu, Qiang Liu, Zhan Sui, Mali Gong, Xing Fu. Spatiotemporal characterization of laser pulse amplification in double-pass active mirror geometry[J]. High Power Laser Science and Engineering, 2020, 8(3): 03000e30
    Download Citation