J. P. Sauppe1, S. Palaniyappan1, E. N. Loomis1, J. L. Kline1、a), K. A. Flippo1, and B. Srinivasan2
Abstract
Hydrodynamic instabilities such as the Rayleigh–Taylor (RT) and Richtmyer–Meshkov instabilities disrupt inertial confinement fusion (ICF) implosions through the growth of 3D perturbations. Growth of these 3D imperfections at the interfaces of an ICF capsule during implosion lead to mixing between materials that is detrimental to performance. These instabilities have been studied extensively in planar geometry, but such experiments lack the effects of convergence in spherical implosions. While several studies have been performed in spherical geometry, these often lack a direct means to measure perturbation growth. Experiments in cylindrical geometry include convergence effects while maintaining direct diagnostic access. Although cylinders have less compression than spheres, they do provide an excellent platform to validate modeling for convergent geometries. The problem with previous cylindrical implosion experiments was that the convergence ratios were limited to ~4. With the National Ignition Facility (NIF), larger cylindrical targets can be driven to convergences of 10–15 while maintaining a large enough final diameter to measure perturbation growth. This paper reviews the design process used to both benchmark radiation hydrodynamics codes and enable 1D post-processed simulations to explore design space to separate compression effects from acceleration/deceleration RT instability. Results from 1D simulations suggest that cylindrical implosions on the NIF can produce high-convergence experiments to validate RT instability growth for ICF implosions.I. INTRODUCTION
Controlling hydrodynamic instabilities such as the Rayleigh–Taylor (RT)1 and Richtmyer–Meshkov (RM)2 instabilities is critical to the success of inertial confinement fusion (ICF).3 For ICF, RT, and RM instabilities are a common problem for all of the current approaches: indirect drive,4 direct drive,3 and magnetic direct drive.5 While considerable efforts have been made to study these instabilities in planar geometries, it is extremely important to include convergence effects in such studies to address imploding ICF systems. Convergence gives rise to Bell–Plesset (BP)6 growth of perturbations, an effect that is most readily apparent for incompressible flows but occurs for compressible flows as well. Convergence also results in a time-dependent change in the wavelength of a perturbation: for a fixed angular harmonic m, the wavelength scales as , where is the interface radius. Thus, experiments to validate our models and improve our understanding of instability growth in this regime are critical for the success of the high-convergence implosions that are needed to achieve ignition on the National Ignition Facility (NIF).7,8
Experiments to measure hydrodynamic instabilities at the various interfaces of a capsule during the implosion through stagnation have been a central focus for ICF. One challenge that has received little attention concerns instabilities on the inner surface of the capsule during the deceleration phase due to the high convergence and small feature sizes near stagnation. For high-convergence spherical systems, approaches have been implemented using imaging9,10 or spectroscopy11–13 of mid-Z dopants buried in the capsule ablator material or measuring fusion reactions between a tritium gas fill and a deuterated plastic shell.14–16 These methods do not resolve the morphology at the surface, but infer mixing from macroscopic measurements or low-resolution images. Strong gradients and potentially kinetic plasma effects make understanding the plasma conditions in the mixing region difficult, and this further complicates comparisons with theory.17 More recently, techniques using the x-ray self-emission from the capsule implosion to backlight the shell have been successfully implemented.18,19 While this approach has shown promise, it does depend on the opacity of the dopant in the shell. A complementary approach is to use cylindrical implosion experiments to more directly validate the physics. While such experiments retain convergence effects, there is still a trade-off due to the reduced compression. High-quality experiments using cylindrical implosions have been demonstrated in the past,20–23 but these were limited to convergences of less than ∼4 owing to limitations on the size of the laser driver and the spatial resolution of the diagnostics. With the energy available on the NIF,7,8 larger directly driven cylindrical implosions can be driven to higher convergence while maintaining final feature sizes that remain measurable with present diagnostic capabilities. Simulations suggest that convergence ratios of ∼10–15 are easily achievable, assuming that the losses due to laser plasma instabilities and cross-beam energy transfer24–27 (which are modeled here with a laser power multiplier in an ad hoc manner) are not excessive. These convergence ratios are comparable to NIF spherical symcap28,29 and liquid layer30,31 implosions, enabling cross comparisons between spherical and cylindrical implosions to evaluate the surrogacy and to elucidate performance degradation in spherical implosions. It should also be noted that the laser-driven cylindrical experiments can be backlit perpendicular to the implosion to measure material compression in a similar manner as in the self-emission backlit images from spherical experiments and for comparison with magnetically driven cylindrical experiments.
This paper describes our experimental design approach and initial NIF scoping studies for cylindrical implosion targets. Since the perturbation growth is a combination of RT, RM, and BP effects, judicious design choices should allow one to differentiate between them. Here, we apply 1D simulation outputs to theoretical models of instability growth that have been validated by 2D design calculations to enable scoping studies using the simpler 1D simulations. This enables large parameter scans with fast turnaround times without the added cost of detailed multidimensional simulations. We first present our designs for initial cylindrical implosion experiments at the OMEGA laser facility32 to provide confidence in the validity of the simulations, and we discuss the scoping studies for the larger-scale NIF experiments in the second half of the paper.
II. OMEGA EXPERIMENTAL DESIGN
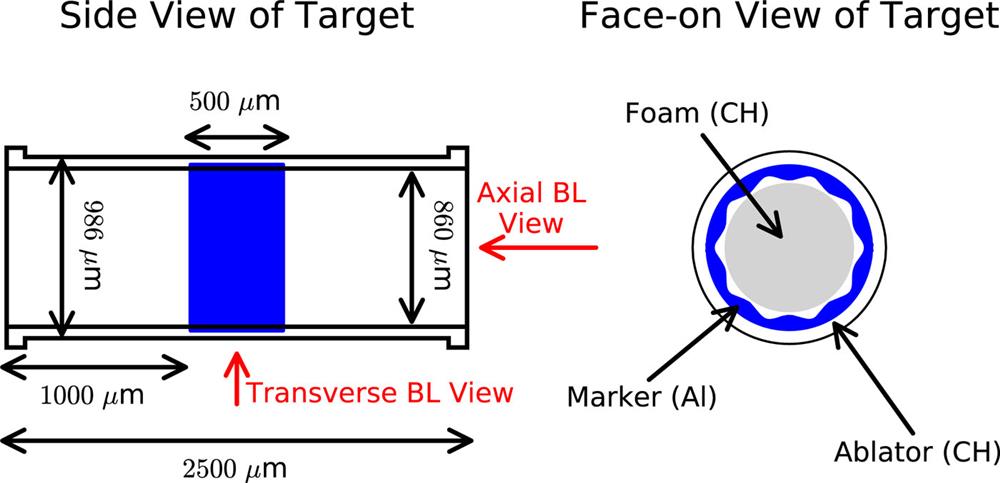
Our initial experiments are designed for the OMEGA laser facility32 to benchmark the cylindrical implosion platform and provide confidence in our modeling approach before moving to the NIF. The design is based on previously fielded cylindrical implosion experiments.33 The cylindrical targets, shown in Fig. 1, are 2500 ± 10 µm long with an outer diameter of 986 ± 2 µm. The outer portion of the target consists of an epoxy ablator (1.25 g/cm3) that is 63 ± 1 µm thick, giving an inner diameter of 860 ± 2 µm. A 500 ± 2 µm long, 8.0 ± 0.1 µm thick Al marker band (2.7 g/cm3) is placed in the center of the cylinder on the inner surface, recessed into the inner wall such that the inner diameter is the same as that of the surrounding epoxy on both sides of the marker band. The cylinder is filled with a 60 mg/cm3 CH foam cylinder with an outer diameter of 858 ± 2 µm that is nearly flush with the inner surface of both the epoxy and marker. Here, we focus on measuring the growth of perturbations on the inner surface during deceleration, so the inner surface of the aluminum marker band is either machined smooth or with periodic azimuthal perturbations.

Figure 1.Schematic layout of target for OMEGA. The imaging axes for the transverse and axial backlighters are also shown.
The cylindrical target is illuminated with 40 OMEGA laser beams using SG5 phase plates in a 1 ns Gaussian square pulse. The beams are offset from the target chamber center ±200 µm along the cylinder axis to provide a nearly flat illumination pattern across the central region containing the marker band. The illumination pattern is predicted to produce a slight hourglass shape along the entire axis, but the implosion of the central marker band is expected to be roughly flat until late times. A metal backlighter foil is mounted 400 µm from one end of the cylinder, and x-rays produced when the foil is illuminated by laser light are used to measure the compression and thickness of the marker layer as well as the subsequent growth of any initial perturbations. A second backlighter foil is mounted perpendicular to the cylinder using the TIM5 positioner to measure the planarity of the marker layer along the cylinder axis during the implosions.
A. Simulation process
The design calculations use the radiation hydrodynamics code xRAGE,34 making use of the newly incorporated laser ray-tracing package.35 Recent work has shown favorable agreement between previous experimental data from cylindrical implosions and xRAGE simulation predictions.36 Our goal here is to use 1D simulations and theoretical models to enable rapid scans of parameter space without the computational cost of 2D simulations. To have any confidence in this type of approach, however, we must first compare the predictions of the 1D simulations and theoretical models with those of appropriate 2D simulations. One type of 2D simulation considers a slice along the axis of the cylinder (r–z simulation), and the other considers a slice perpendicular to the cylinder axis and through the center of the marker layer (r–θ simulation). The r–z simulations capture axial variations in the target, and the r–θ calculations capture azimuthal variations. Results from representative r–z and r–θ calculations can be seen in Figs. 2(a) and 2(b) respectively, which show the logarithm of the mass density at various points in time. The laser beam pointings are also shown as red lines in the first image for each simulation.
Figure 2.Simulated density profiles from (a) r–z computation and (b) r–θ computation (m = 10, a0 = 3 µm initially).
Synthetic radiographs are produced by appropriately rotating and translating the 2D simulation results to form a 3D model of the imploding cylinder, following the procedure outlined in Ref. 36. Beginning from a given set of image pixels, rays are traced through the 3D model of the cylinder, integrating the attenuation for each cell and then passing through a specified pinhole position. The attenuation coefficients for each cell are determined using the TOPS opacity code37 and the cell material, density, and temperature for a given x-ray photon energy. Once the transmission has been calculated for all rays through a given pinhole, it is possible to convolve detector spatial resolution, motion blur, and noise if desired. This process can be repeated for different pinhole positions to examine the effect of parallax. Example side-on synthetic radiographs for the r–z calculations are shown in Fig. 3(a). The dark region in the images represents the aluminum marker band, and some marker bowing is evident at late times. Azimuthal variations in the cylindrical target are modeled by incorporating results from the r–θ simulations over just the inner 500 µm extent of the marker band, while the r–z simulation results are used outside of this region. Synthetic radiographs looking down the cylinder axis that include the azimuthal variation in this way are shown in Fig. 3(b). The same analysis techniques used for the experimental radiographs can be applied to the synthetic radiographs to make the comparison as similar as possible.
Figure 3.(a) Side-on synthetic radiographs from the r–z simulation shown in Fig. 2(a). (b) Down-axis synthetic radiographs incorporating the r–θ results shown in Fig. 2(b).
To verify the self-consistency between the two types of 2D simulations, two sets of synthetic radiographs looking down the cylinder axis were compared. The first set was constructed using the r–z simulation results outside of the 500 µm marker extent and results from an r–θ simulation with no initial perturbation over just the inner 500 µm marker extent. The average inner surface of the marker layer was matched between the two simulations, and the synthetic radiographs constructed by combining both types of simulation are shown in Fig. 4(a). The second set of synthetic radiographs, shown in Fig. 4(b), was constructed using the r–z simulation results along the entire axial extent of the cylinder, neglecting any azimuthal variation. The marker layer appears slightly thicker here because the r–z simulation includes the marker bowing, which is missed when the r–θ simulations are used over the 500 µm marker extent. However, there is general qualitative agreement between the two sets of synthetic radiographs, and, in particular, the inner surface position agrees quite well between them.
Figure 4.A comparison of synthetic radiographs looking down the cylinder axis. (a) Results from an r–θ simulation with no initial perturbation are used over the 500 µm marker extent. (b) r–z simulation results are used over the entire axial extent.
A more quantitative comparison of the inner surface position is seen in Fig. 5, which shows the radial position of the inner surface extracted from the two sets of synthetic radiographs described above, along with the inner surface position extracted from a 1D simulation. The results demonstrate self-consistency between all three types of simulations, and this provides confidence in our use of 1D simulations for quick sensitivity and design studies that explore perturbation growth. Since the perturbation growth is a combination of BP and RT effects, variation in the acceleration/deceleration profile and convergence can vary the relative growth due to each. To understand the role that each effect plays, regimes that accentuate one over the other can be used to help validate the physics models. Thus, using a broad range of simulations in 1D can help evaluate design spaces for various drives.
Figure 5.Inner marker radius vs time for 1D, 2D r–θ, and 2D r–z simulations.
B. Verifying 1D models for 2D perturbation growth
We now demonstrate that the 1D simulations are suitable for exploring design space by using the 1D simulation results as inputs into theoretical models of perturbation growth and comparing these predictions with results from 2D r–θ simulations. The time-dependent acceleration/deceleration and Atwood number are extracted from the 1D simulations, and these values are fed into linear and weakly nonlinear theoretical models to calculate the perturbation growth. Each theory accounts for BP effects.38Figure 6 shows an example of the calculated time-dependent perturbation growth. Figure 6(a) shows the radius vs time from a 1D simulation, along with the velocity and acceleration vs time calculated from the radius vs time data. Figure 6(b) shows the time-dependent densities on either side of the interface at the inner surface of the aluminum marker band, along with the Atwood number determined from those densities. The predicted growth of a mode 10 perturbation that is initialized at 3 µm amplitude at 2 ns is shown in Fig. 6(c) for a linear theory from Ref. 38 and a weakly nonlinear buoyancy-drag (BD) model.39 Here, the nonlinear theory is modified to account for the effects of convergence in an ad hoc manner by multiplying the bubble and spike amplitudes predicted from this theory by the width of the marker layer extracted from the cylindrical simulation.
Figure 6.(a) Radius vs time for the inner surface of the cylinder with subsequent calculations of velocity and acceleration of the interface. (b) Density on each side of the inner surface interface and the corresponding Atwood number. (c) Predicted amplitudes for mode 10 growth using the linear theory of Ref. 38 and a modified nonlinear theory of Ref. 39, which predicts different growth rates for bubbles and spikes.
The initialization time for the theories is chosen based on when the acceleration profile settles down after the shocks have finished reverberating in the marker. The initial amplitude is unimportant for the linear theory (so the amplitude here can be easily recast as a growth factor), but the nonlinear theory does depend on this value. Here, the linear and nonlinear theories begin to diverge once the perturbation has grown sufficiently large. The interface is at 200 µm radius at 4 ns, so the wavenumber at this time is k = m/r ∼ 0.05 µm−1. The wavenumber–amplitude product is then kaℓ ∼ 0.4, near the limit of validity for the linear theory. At very late times, the nonlinear theory predicts slightly different growth rates for the bubbles and spikes of the perturbation, an effect that is entirely excluded from the linear theory. These theoretical curves are only continued until the rebounding shock strikes the interface just before 6 ns, at which point additional RM growth occurs.
Using this methodology for determining the time-dependent growth from 1D calculations, the growth estimates vs time are compared with the estimate of growth extracted from the 2D r–θ calculations. Figure 7 shows the radius vs time for 1D and 2D r–θ simulations and compares the perturbation growth seen in the 2D simulations with the predictions from both the linear and weakly nonlinear theories using the 1D simulation results as input. Figure 7(a) shows this comparison for a mode 4 perturbation with a 4 µm initial amplitude, and Fig. 7(b) shows it for a mode 10 perturbation with a 3 µm initial amplitude. The 2D perturbation amplitude is extracted from synthetic x-ray radiographs constructed as previously described. The linear theory tends to overpredict the perturbation growth slightly, which is not surprising given that this model breaks down for larger perturbation amplitudes. The nonlinear theory tends to underpredict the perturbation growth slightly. In the mode 4 case, the predicted bubble and spike amplitudes are only just beginning to deviate from each other at late times, while in the mode 10 case this deviation is more pronounced. Future work will examine both of these models in greater detail and make comparisons with experimental data. Using the 1D simulation results as input to theoretical models for predicting perturbation growth provides a suitable approximation of the perturbation growth for this cylindrical implosion design.
Figure 7.Comparison of 2D xRAGE simulations of perturbation growth with the linear theory of Ref. 38 and the weakly nonlinear buoyancy-drag (BD) model of Ref. 39 for (a) the m = 4 mode at 4 µm initial amplitude and (b) the m = 10 mode at 3 µm initial amplitude.
C. Simulated sensitivities
While the 1D simulations give good estimates of the expected growth rate based on 2D simulations, there is uncertainty in the coupling of the laser energy to the target due to refraction in the blow-off plasma and potentially cross-beam energy transfer.24–27 The current cylinder experimental design uses new SG5 phase plates with a different laser spot size than previous experiments, which used SG4 phase plates. This introduces additional uncertainty in the coupling efficiency over past experiments and prevents the direct use of previous data to estimate laser coupling to the target. More recent work has examined this coupling of laser energy to directly driven cylindrical targets,40 but the target and laser pointings differed from what is considered here. A scan was completed to evaluate the sensitivity to coupling in order to ensure that the growth will be observable and to set the timing of the cameras. To emulate a reduction in coupling efficiency, the laser energy in the 1 ns pulse is reduced from 15 kJ to 8 kJ total. The results show that as the laser energy drops, the time to final convergence increases. In all cases, the convergence, defined as initial inner surface radius divided by the final inner surface radius, is ∼4. This is shown in Fig. 8(a).
Figure 8.(a) Radius of inner surface of marker band vs time for various laser coupling efficiencies. (b) Calculated linear growth factor vs time for modes 4 and 10 for the corresponding coupling efficiencies.
The simulations also predict that the linear growth factors increase as the laser energy decreases, as shown in Fig. 8(b) for m = 10 (solid lines) and m = 4 (dashed lines) initial perturbations. This is due to the fact that the growth during the deceleration phase varies as gt2, where g is the acceleration and t is time. Extending the growth time t leads to larger final sinusoidal features compared with increasing the amplitude g of the deceleration. Unlike in planar geometries, these two quantities are related in convergent geometries. As is evident, the deceleration g can be increased by increasing the initial ablator velocity (for fixed foam density), but this results in a faster shock and earlier shock rebound, reducing the deceleration growth time t before reshock of the interface occurs. Future work will investigate this co-dependent relationship more closely. The goal for our OMEGA cylindrical implosion experiments is to optimize the growth of the perturbations to ensure high-quality measurements.
III. NIF EXPERIMENTAL DESIGNS
A. Hydro-scaled designs
The NIF is a 192-beam laser system designed for indirect drive ICF. The beams are arranged into 48 quads, i.e., sets of four beams. These quads are further arranged into inner and outer cones. The two overlapping inner cones consist of four quads at 23.5° and four quads at 30°, each relative to the hohlraum axis of rotation. The outer cones consist of eight quads at 44.5° and a further eight quads at 50° each. The axial symmetry of the beams provides a uniform driver for direct drive cylindrical implosions. For the cylindrical implosion experiments, the 44.5° and 50.0° beams are used to drive the cylinder, and the 23.5° and 30° beams from the lower hemisphere are used to drive the backlighter for imaging down the cylinder axis.
The strategy for cylindrical implosion experiments on the NIF is to first develop a target that is hydrodynamically scaled up from the OMEGA target by a factor of three (Fig. 9). The NIF-scale cylindrical targets have an outer radius of 1479 ± 2 µm. The outer portion of the target consists of an epoxy ablator that is 189 ± 1 µm thick, giving an inner radius of 1290 ± 2 µm. An 800 ± 2 µm long, 24.0 ± 0.1 µm thick Al marker band is placed in the center of the cylinder on the inner surface, recessed into the inner wall such that the inner diameter is the same as that of the surrounding epoxy on both sides of the marker band. A 5000 ± 2 µm long CH foam cylinder with a radius of 1278 ± 2 µm is inserted inside the target. For practical reasons, the target length is not scaled by the same factor as the radius. The energy requirements for hydrodynamic scaling of a spherical implosion are well known: E ∼ r3, where r is the capsule radius.41 For a cylinder, however, the energy requirements scale with the mass of the driven portion of the cylindrical target, Ecyl ∼ r2L. Thus, reducing the illuminated length reduces the required laser energy, provided that the marker region is kept axially uniform during the implosion. For the NIF, this reduces the required laser energy from ∼500 kJ to ∼235 kJ, allowing for even larger cylinders to be considered in the future.
Figure 9.(a) Pie diagram showing the radial hydrodynamic scaling of the OMEGA cylinder design (the void between CH foam and Al marker is not modeled here). (b) Schematic of the NIF-scale target.
Based on this hydro-scaled design, a series of design calculations have been conducted to achieve high convergence ratios, ∼10–15. There remain uncertainties, however, since much of the important physics does not scale. Examples include laser plasma instabilities, thermal conduction (which enables energy transfer between the laser critical surface and the ablation front), and differences in the laser illumination pattern. However, the strategy utilizes experience from direct drive capsule implosion experiments conducted on OMEGA and NIF, and our proposed OMEGA experiments should provide valuable information for designing the NIF cylindrical implosion experiments.
The differences in both the target dimensions and the laser beam parameters between OMEGA and NIF necessitate additional xRAGE simulations to determine the optimal beam pointing to achieve a nearly axially uniform implosion of the marker layer. Density plots from several r–z computations are shown in Fig. 10 for different axial offsets of the laser beams. The simulations show that the uniformity of the marker band during the implosion is quite sensitive to the pointing, and changes of ±25 µm lead to noticeable distortions of the marker layer. However, when the beams are shifted axially to ±1025 µm, the distortion of the marker occurs mostly near the edges, enabling a relatively clean measurement along the central portion of the marker layer.
Figure 10.Laser power deposition (left column) and mass density (four right columns) at several different times, showing marker bowing for NIF-scale r–z computations with an 800 µm long marker. Laser beams are displaced axially by (a) 1000 µm, (b) 1025 µm, and (c) 1050 µm.
B. High-convergence designs
The primary goal of the cylindrical implosion platform is to study deceleration-phase RT instability at a convergence that is similar to symcap implosion experiments. This enables a cross comparison of the directly observed perturbation growth in the cylinder with measurements from spherical implosions that infer the mix using x-ray10,18,42 or nuclear14–16 diagnostics. The larger target sizes on NIF should enable higher convergence while keeping the perturbation features large enough to be accurately measured. The drive in 1D simulations was benchmarked to the 2D hydro-scaled r–z simulations presented above. From this, additional 1D simulations were performed to scan the large parameter space of target dimensions and laser pulse shapes in an attempt to identify a high convergence design for the NIF-scale targets. A sample of the results is shown in Fig. 11. Making some minor modifications to the hydro-scaled design and lowering the density of the central foam, it appears to be relatively easy to reach convergences of ∼17 with a final inner radius of the order of 100 µm, where low-mode perturbations should still be diagnosable.
Figure 11.Results from 1D simulations of the NIF-scale target using a 3 ns square pulse: (a) 1.0× hydro-scaled drive and 60 mg/cm3 foam fill; (b) 1.0× hydro-scaled drive and 30 mg/cm3 foam fill; (c) 1.5× hydro-scaled drive and 30 mg/cm3 foam fill; (d) 2.0× hydro-scaled drive and 30 mg/cm3 foam fill; (e) 1.0× hydro-scaled drive and 10 mg/cm3 deuterium fill; (f) 1.0× hydro-scaled drive and 5 mg/cm3 deuterium fill.
IV. CONCLUSIONS
Cylindrical implosion experiments utilizing the large amount of laser energy available on the NIF should allow direct measurements of perturbation growth on the inner surface at high convergence ratios. Such measurements can be used to validate computational models and can be compared with spherical implosion performance. Experiments are being planned for both the OMEGA laser facility and the NIF to test the designs. The OMEGA design simulations demonstrate self-consistency between 2D r–z and r–θ simulations with 1D simulation results. Theoretical models of perturbation growth that use the 1D simulations as input compare favorably with predictions of mode growth in 2D simulations. The cross comparison enables large suites of simulations in 1D to scope the best experiments to separate BP and RT effects. Simulations of targets for the NIF show that convergences comparable to ICF symcap implosions can be achieved while sustaining the ability to directly measure perturbation growth.
References
[1] G. Taylor. Proceedings of the Royal Society of London A: Mathematical, Physical and Engineering Sciences, 192-196(1950).
[2] R. D. Richtmyer. Commun. Pure Appl. Math., 13, 297(1960).
[3] A. Thiessen, G. Zimmerman, L. Wood, J. Nuckolls. Nature, 239, 139(1972).
[4] J. Lindl. Phys. Plasmas, 2, 3933(1995).
[5] K. Peterson, M. Cuneo, D. Sinars, M. Herrmann, R. Vesey, A. Sefkow, D. Rovang, S. Slutz. Phys. Plasmas, 17, 056303(2010).
[6] M. Plesset. J. Appl. Phys., 25, 96(1954).
[7] R. Boyd, R. Al-Ayat, B. Remington, E. Moses, C. Keane. Phys. Plasmas, 16, 041006(2009).
[8] E. Campbell, J. Paisner, W. Hogan. Fusion Technol., 26, 755(1994).
[9] F. Marshall, R. Town, V. Goncharov, T. Sangster, J. Delettrez, S. Regan, D. Meyerhofer, B. Yaakobi, V. Smalyuk. Phys. Plasmas, 9, 2738(2002).
[10] T. Nagayama, J. Delettrez, P. Hakel, R. Mancini, S. Regan, V. Smalyuk, H. Johns. Phys. Plasmas, 21, 082711(2014).
[11] S. Regan, H. Scott, D. Callahan, R. Epstein, C. Cerjan, B. Hammel, G. Collins, M. Barrios, L. Suter, D. Bradley et al. Phys. Rev. Lett., 111, 045001(2013).
[12] L. Suter, S. Haan, T. Dittrich, R. McEachern, C. Keane, B. Hammel, R. Turner. Phys. Rev. Lett., 73, 2324(1994).
[13] S. Langer, H. Scott, B. Hammel, W. Levedahl, R. Cook, O. Landen, D. Munro, T. Dittrich, C. Keane. Rev. Sci. Instrum., 66, 689(1995).
[14] R. Chrien, C. Keane, J. Colvin, B. Hammel, N. Hoffman, O. Landen. Phys. Plasmas, 5, 768(1998).
[15] T. Sangster, P. Ebey, D. Wilson, V. Yu. Glebov, W. Shmayda, R. Lerche. Phys. Plasmas, 18, 112707(2011).
[16] G. Grim, R. Tipton, S. Weber, M. Barrios, D. Casey, J. Pino, L. Benedetti, D. Rowley, V. Smalyuk, B. Remington et al. Phys. Rev. Lett., 112, 025002(2014).
[17] S. Gales, V. Y. Glebov, M. Schmitt, H. Herrmann, K. Meaney, A. Zylstra, A. Leatherland, N. Hoffman, C. Forrest, Y. Kim et al. Phys. Rev. E, 97, 061201(2018).
[18] L. Benedetti, R. Hatarik, S. Haan, B. Hammel, L. Berzak Hopkins, V. Smalyuk, D. Bradley, J. Field, H. Robey, L. Pickworth et al. Phys. Plasmas, 25, 054502(2018).
[19] H. Robey, O. Landen, A. MacPhee, H. Scott, B. Hammel, M. Barrios, L. Pickworth, S. Regan, V. Smalyuk, M. Schneider et al. Phys. Rev. Lett., 117, 035001(2016).
[20] J. Beck, D. Bradley, D. L. Tubbs, C. W. Barnes, J. Knauer, J. Oertel, N. Hoffman, R. Watt, T. Boehly, K. Klare. Rev. Sci. Instrum., 70, 471(1999).
[21] J. Beck, C. W. Barnes, S. Rothman, B. Thomas, J. Edwards, P. Graham, N. Hoffman, D. Galmiche, W. Hsing, A. Richard. Phys. Plasmas, 4, 1832(1997).
[22] W. W. Hsing, N. M. Hoffman. Phys. Rev. Lett., 78, 3876(1997).
[23] R. G. Watt, N. M. Hoffman, T. Boehly, J. A. Oertel, J. B. Beck, J. Knauer, D. Bradley, P. Jaanimagi, C. W. Barnes, D. L. Tubbs. Phys. Plasmas, 6, 2095(1999).
[24] D. Edgell, V. Goncharov, D. Froula, R. Follett, I. Igumenshchev, L. Divol, R. Craxton, W. Seka, R. Epstein, D. Michel et al. Phys. Plasmas, 19, 056314(2012).
[25] D. Pennington, J. Moody, D. Montgomery, B. MacGowan, T. Weiland, R. Kirkwood, B. Afeyan, W. Kruer, S. Wilks. Phys. Rev. Lett., 76, 2065(1996).
[26] S. C. Wilks, W. L. Kruer, R. K. Kirkwood, B. B. Afeyan. Phys. Plasmas, 3, 382(1996).
[27] L. Divol, C. Thomas, S. Haan, E. Williams, J. Salmonson, D. Hinkel, P. Michel, S. Dixit, S. Weber, D. Callahan et al. Phys. Rev. Lett., 102, 025004(2009).
[28] J. Field, R. Tommasini, T. Ma, S. MacLaren, J. Ralph, S. Khan, G. Kyrala, J. Pino, J. Salmonson, J. Rygg et al. Phys. Plasmas, 23, 042708(2016).
[29] J. Lindl, B. Spears, S. Haan, J. Milovich, O. Landen, S. Weber, J. Edwards, D. Clark, B. MacGowan, H. Robey et al. Phys. Plasmas, 18, 051002(2011).
[30] J. Sater, R. Olson, S. Yi, R. Leeper, A. Zylstra, J. Kline, J. Biener, T. Braun, B. Kozioziemski, P. Bradley et al. Phys. Rev. Lett., 117, 245001(2016).
[31] R. Olson, R. Leeper. Phys. Plasmas, 20, 092705(2013).
[32] R. Craxton, J. Knauer, D. Brown, S. Kumpan, S. Loucks, S. Letzring, J. Kelly, R. Keck, T. Kessler, T. Boehly et al. Opt. Commun., 133, 495(1997).
[33] S. Rothman, C. Horsfield, J. Fincke, S. Batha, K. Parker, N. Lanier, G. Magelssen. Phys. Plasmas, 13, 042703(2006).
[34] M. Gittings, R. Coker, R. Hueckstaedt, K. New, W. R. Oakes, R. Weaver, T. Betlach, M. Clover, N. Byrne, E. Dendy et al. Comput. Sci. Discovery, 1, 015005(2008).
[35] S. Regan, D. Turnbull, T. Collins, P. McKenty, M. Rosenberg, J. Marozas, P. Radha, J. Zuegel, F. Marshall, M. Hohenberger et al. Phys. Plasmas, 25, 056314(2018).
[36] S. Palaniyappan, E. N. Loomis, B. M. Haines, P. A. Bradley, J. P. Sauppe, J. L. Kline, S. H. Batha. Phys. Plasmas, 26, 042701(2019).
[37] R. E. H. Clark, J. Abdallah. TOPS: A multigroup opacity code(1985).
[38] R. Epstein. Phys. Plasmas, 11, 5114(2004).
[39] L. Arazi, Y. Srebro, O. Sadot, Y. Elbaz, D. Shvarts. Laser Part. Beams, 21, 347(2003).
[40] A. Sefkow, J. Knauer, E. Hansen, R. Betti, P.-Y. Chang, J. Davies, D. Barnak, S. Regan, J. Peebles, E. Campbell. Phys. Plasmas, 25, 122701(2018).
[41] M. Patel, M. Marinak, B. Hammel, A. Kritcher, D. Clark, S. Haan, P. Patel, J. Koning, J. Milovich, C. Weber et al. Nucl. Fusion, 59, 032008(2018).
[42] D. Meyerhofer, B. Yaakobi, S. Regan, F. Marshall, J. Delettrez, V. Goncharov, V. Smalyuk. Phys. Rev. Lett., 87, 155002(2001).