
Yun-Ping Qi, Ting Zhang, Jia Guo, Bao-He Zhang, Xiang-Xian Wang. High performance temperature and refractive index dual-purpose sensor based on the ethanol-sealed metal-dielectric-metal waveguide [J]. Acta Physica Sinica, 2020, 69(16): 167301-1
- Acta Physica Sinica
- Vol. 69, Issue 16, 167301-1 (2020)
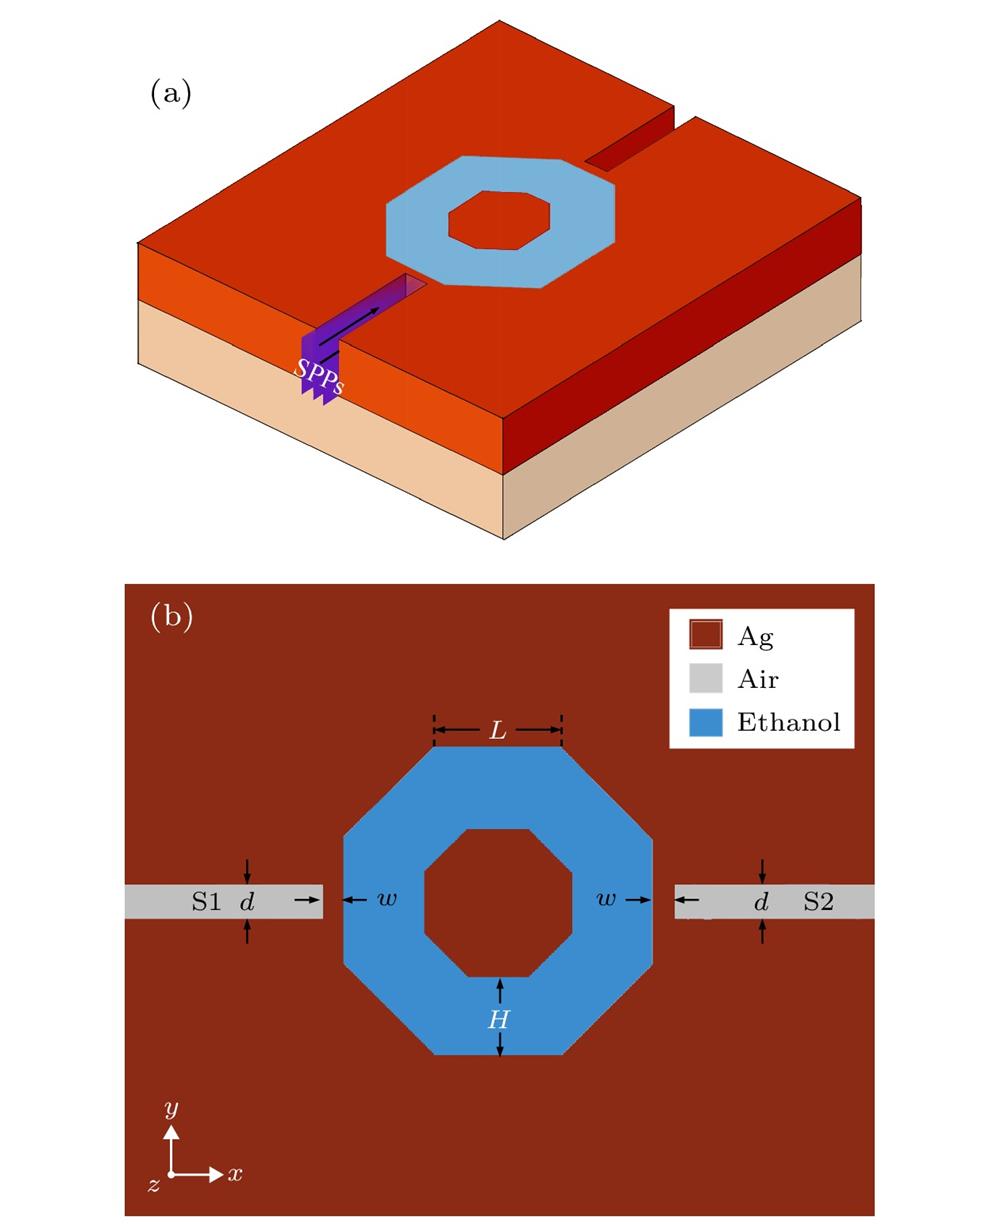
Fig. 1. The structure schematic of two slits MIM SPPs waveguides with a regular octagon ring resonator: (a) 3D model; (b) 2D model.
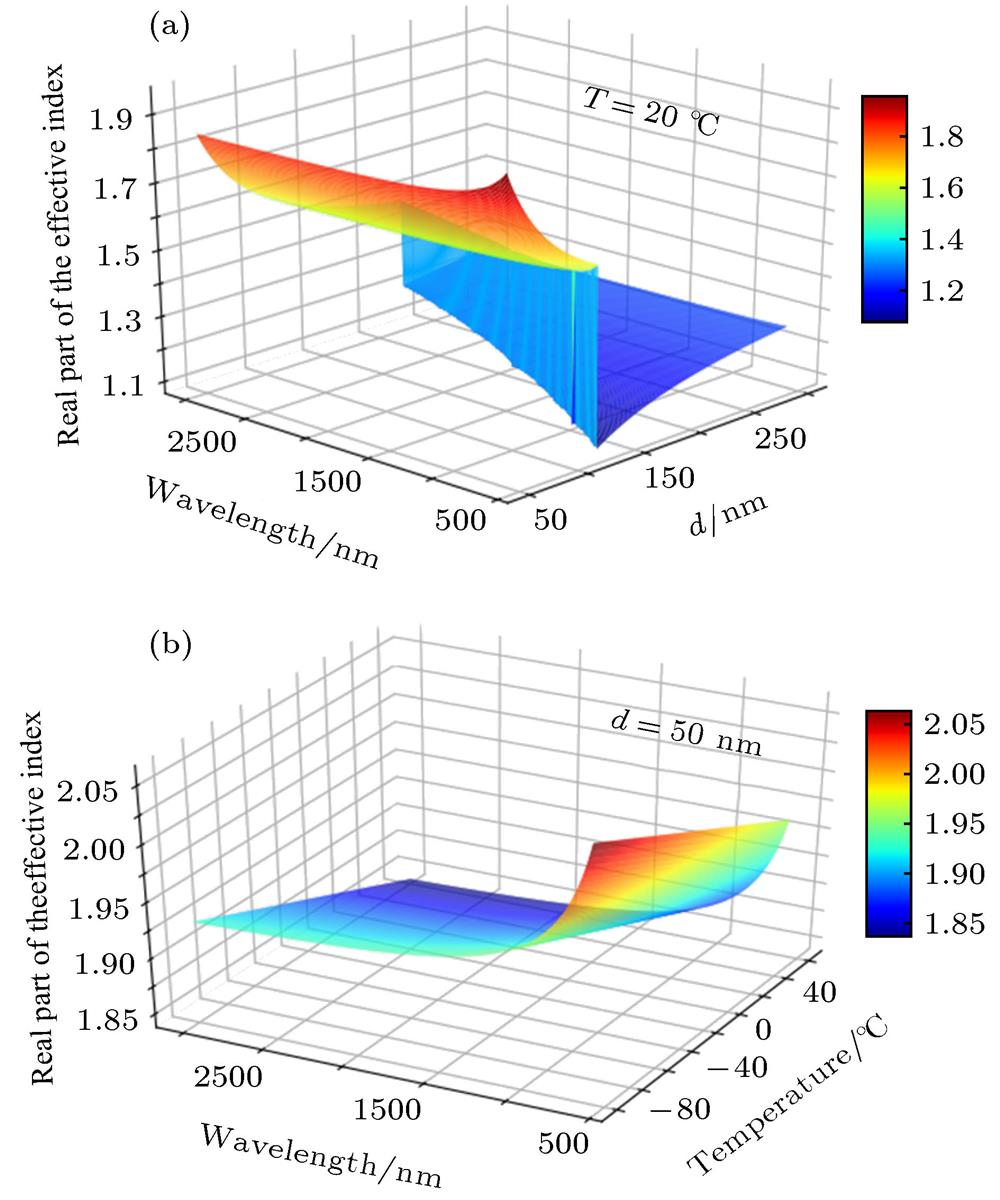
Fig. 2. (a) The real part of
 as functions of wavelength and
 d when T = 20 ℃; (b) the real part of
 as functions of wavelength and
 T when d = 50 nm.
as functions of wavelength and as functions of wavelength and Fig. 3. (a) Comparison of the simulation and the theoretical results of transmittance of the temperature sensor; (b) the magnetic field
 of peak I at
 ; (c) the magnetic field
 of peak II at
 ; (d) the magnetic field
 of peak III at
 ; (e) the magnetic field
 of peak IV at
 ; (f) the magnetic field
 of peak V at
 .
.
of peak I at
; (c) the magnetic field
of peak II at
; (d) the magnetic field
of peak III at
; (e) the magnetic field
of peak IV at
; (f) the magnetic field
of peak V at
. Fig. 4. The transmission spectra of the temperature sensor under different T : (a) Peak I, Peak II and Peak III in the wavelength range of 690 nm to 1100 nm; (b) peak IV and Peak V in the wavelength range of 1000 nm to 2500 nm.
Fig. 5. The relationship between the resonance wavelength and T of the five transmission peaks.
Fig. 6. The transmission spectra of the structure under different H : (a) In the wavelength range of 690 nm to 1100 nm; (b) in the wavelength range of 1000 nm to 2500 nm. (c) the transmission spectra of the structure under different L in the wavelength range of 1000 nm to 3000 nm; (d) the relationship between sensitivity of Peak V and Peak IV and parameter H ; (e) the relationship between sensitivity of Peak V and Peak IV and parameter L .
Fig. 7. (a) The transmission spectra of the structure under different w ; (b) when the temperature changes from 20 ℃ to –20 ℃, the displacement of Peak IV at w = 5 nm and w = 10 nm; (c) the transmission spectra of the structure with different wavelength and w ; (d) when the temperature changes from 20 ℃ to –20 ℃, the displacement of Peak V at w = 5 nm and w = 10 nm.
Fig. 8. (a) When the system is used as a temperature sensor, the transmission spectra at T = 20 ℃ and T = –20 ℃; (b) when the system is used as a refractive index sensor, the transmission spectra at n = 1 and n = 1.01.
|
Table 1. Performance comparison of various temperature sensors and refractive index sensors.

Set citation alerts for the article
Please enter your email address
© Copyright 2018-2021 | Chinese Laser Press. All Rights Reserved 沪ICP备15018463号-20