Author Affiliations
1School of Surveying and Mapping, Wuhan University, Wuhan, Hubei 430079, China2Disaster Monitoring and Prevention Research Center of Wuhan University, Wuhan, Hubei 430079, China3Key Laboratory for Digital Land and Resources of Jiangxi Province, East China University of Technology, Nanchang, Jiangxi 330013, Chinashow less
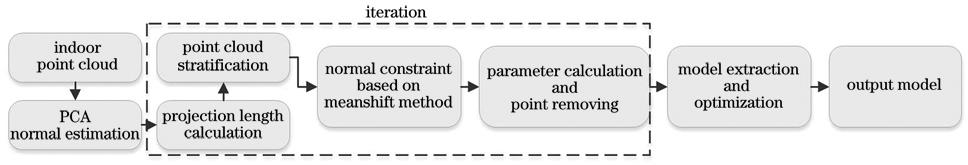
Fig. 1. Processing flow of proposed method
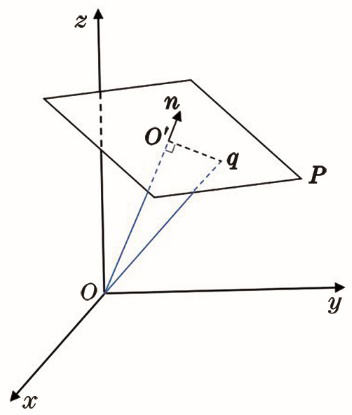
Fig. 2. Projection length model of point cloud
Fig. 3. Three sets of data used in experiment. (a) data 1; (b) data 2; (c) data 3
Fig. 4. Number of stratified point clouds
Fig. 5. Normal Gaussian map and point cloud before and after normal constraint. (a) Gaussian ball; (b) partial zoom; (c) constrained normal vector; (d) point cloud at maximum layer 1; (e) point cloud at maximum layer 2; (f) constrained point cloud
Fig. 6. Preliminary segmentation results of data 1. (a) Partitioned plane point clouds; (b) floor and ceiling plans; (c) residual point clouds
Fig. 7. Plane segmentation results of data 1 after model optimization
Fig. 8. Plane segmentation results of point clouds in data 2 and data 3. data 2 plane point cloud, (a) segmentation results, (b) residual point cloud; data 3 plane point cloud, (c) segmentation results, (d) residual point cloud
Plane | A | B | D |
---|
Plane 1 | 213.2745 | 0.0305 | 1971.6564 | Plane 2 | -2.5988×10⁻⁵ | 1.7823×10⁻⁵ | -0.0034 | Plane 3 | 26.3625 | -26.9836 | 469.1850 | Plane 4 | -2.7181×10⁻⁶ | 1.0147×10⁻⁵ | 3.3648 | Plane 5 | -82.5261 | -0.3624 | -1122.2972 | Plane 6 | -498.5125 | 0.0325 | -5334.4432 | Plane 7 | -281.2597 | -281.1161 | -2618.1471 | Plane 8 | 0.0016 | 1.1324×10⁻⁴ | 1.1738 | Plane 9 | 0.0273 | -148.1639 | 77.4453 | Plane 10 | -0.2417 | -93.3212 | 197.1178 | Plane 11 | 25.7364 | -25.7179 | 454.0566 |
|
Table 1. Parameters of planes in point cloud of data 1 scene
Parameter | Plane 1 | Plane 2 | Plane 3 | Plane 4 | Plane 5 | Plane 6 | Plane 7 | Plane 8 | Plane 9 | Plane 10 |
---|
ρ | 9.244 | 0.003 | 12.433 | 3.365 | 13.598 | 10.701 | 6.584 | 1.174 | 0.523 | 2.112 | Peak interval | [9.225,9.275] | [0.025,0.075] | [12.425,12.475] | [3.325,3.375] | [13.625,13.675] | [10.675,10.725] | [6.575,6.625] | [1.125,1.175] | [0.475,0.525] | [2.125,2.175] |
|
Table 2. Comparison between peak interval of projection length ρ of plane model and projection length of point cloud
Object | Modeldistance /m | Average distance /m | Measured distance /m | Distanceerror /mm | Relative accuracy /% |
---|
Ceiling-desktop Desktop-ceiling | 2.25982.2592 | 2.2595 | 2.2572 | 2.3 | 99.89 | Floor-ceilingCeiling-floor | 3.02253.0221 | 3.0223 | 3.0180 | 4.3 | 99.86 | Front wall-back wallBack wall-front wall | 5.97305.9744 | 5.9737 | 5.9749 | 1.2 | 99.97 | Left wall-right wallRight wall-left wall | 7.75777.7544 | 7.7561 | 7.7532 | 2.9 | 99.96 |
|
Table 3. Segmentation precision of plane point cloud
Object | Ceiling | Floor | Desktop | Front wall | Back wall | Left wall | Right wall |
---|
Deflection angle/(°) | 0.077 | 0.056 | 0.147 | 0.028 | 0.170 | 0.135 | 0.103 |
|
Table 4. Deflection angle of planes
Data | Number of points | Proposed method /s | MLESAC method/s | Improved 3D-HT method /s |
---|
1 | 114582 | 4.760 | 15.687 | 10.291 | 2 | 409286 | 16.724 | 60.385 | 31.516 | 3 | 1672434 | 67.997 | 208.213 | 140.930 |
|
Table 5. Segmentation time-consuming of plane point clouds