
Xiao Li, Meizhen Ren, Jiashun Zhang, Liangliang Wang, Wei Chen, Yue Wang, Xiaojie Yin, Yuanda Wu, Junming An, "Interference at the single-photon level based on silica photonics robust against channel disturbance," Photonics Res. 9, 222 (2021)
- Photonics Research
- Vol. 9, Issue 2, 222 (2021)
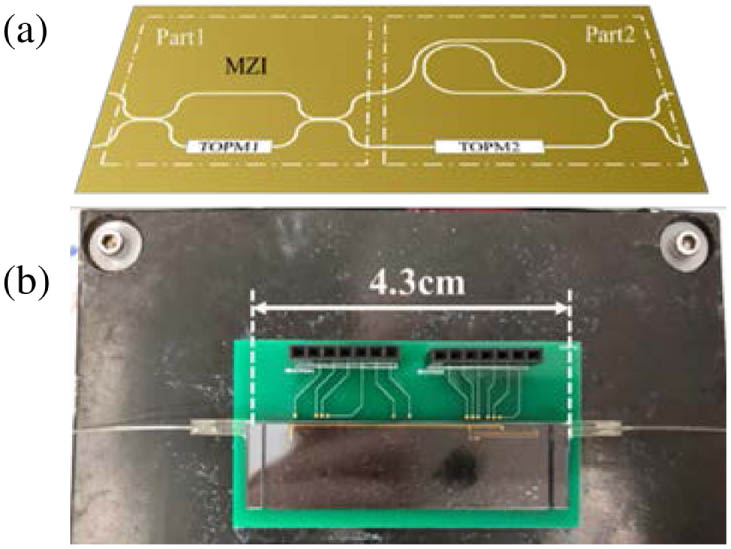
Fig. 1. Silica PLC device. (a) Schematic of our AMZI chip. (b) A photograph of the chip packaging. The device contacts the surface of the TEC platform and is covered with a heat-insulating shell when the operation is on.
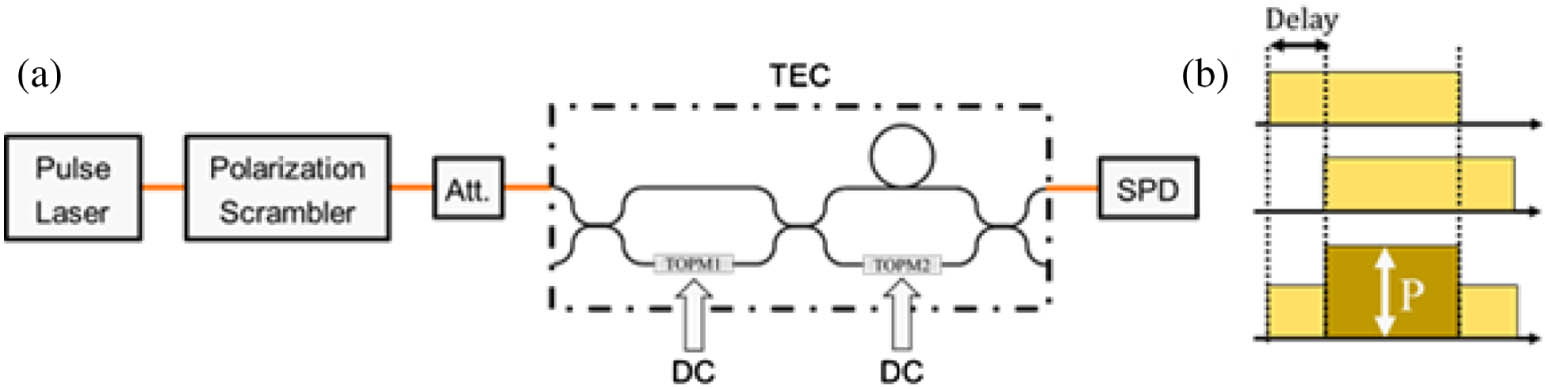
Fig. 2. (a) Experimental setup to investigate the polarization characteristics of a 740 ps delay AMZI chip at the single-photon level. Att., variable optical attenuator; DC, direct current voltage drive; TEC, temperature controller. (b) Graph illustrating the pulse self-interfering method.
Fig. 3. (a) Interference fringes observed for 740 ps delay AMZI chip when device temperature is scanned from 10°C to 60°C. (b) The fitting curve of our proposed model by Eq. (8 ). The y y = ( 5.46 × T + 13 ) × ( 0.089 × T − 1.29 ) V = 0
Fig. 4. Experimental setup with minor variation on the one in Fig. 2 (a). PBS, polarization beam splitter. Single-mode fiber (SMF) is in yellow; polarization maintaining fiber (PMF) is in blue.
Fig. 5. (a) Interference fringes versus device temperature, associated with the TE (red) and TM (blue) modes. The top black curve is the sum of the TE and TM modes. The minimum visibility occurs at 29.2°C, corresponding to Δ ϕ = ( 2 N + 1 ) π Δ ϕ = 2 N π
Fig. 6. Interference fringes of the TE (red) and TM (blue) modes versus device temperature scanned from 10°C to 50°C; (a) and (b) correspond to 200 ps and 400 ps, respectively. The top black curve is the sum of the TE and TM modes.
Fig. 7. Interference fringes of the TE (red) and TM (blue) modes versus device temperature, scanned from 10°C to 60°C for Bob’s 740 ps delay AMZI chip. The top black curve is the sum of the TE and TM modes.
Fig. 8. Experimental setup to prove robustness against polarization disturbance of our interferometers based on silica 740 ps delay AMZI chips.
Fig. 9. Fringe visibility versus T T
Fig. 10. Proof of long-term stability of our setup. Plot of the extinction ratio between the two outputs from Bob against time over 6 h. The inset shows interference fringes of the two outputs of Bob’s AMZI chip.


Set citation alerts for the article
Please enter your email address

© Copyright 2018-2021 | Chinese Laser Press. All Rights Reserved 沪ICP备15018463号-20