
Hao Ouyang, Si-Yang Hu, Man-Ling Shen, Chen-Xi Zhang, Xiang-Ai Cheng, Tian Jiang. Polarization-dependent nonlinear optical response in GeSe2 [J]. Acta Physica Sinica, 2020, 69(18): 184212-1
- Acta Physica Sinica
- Vol. 69, Issue 18, 184212-1 (2020)
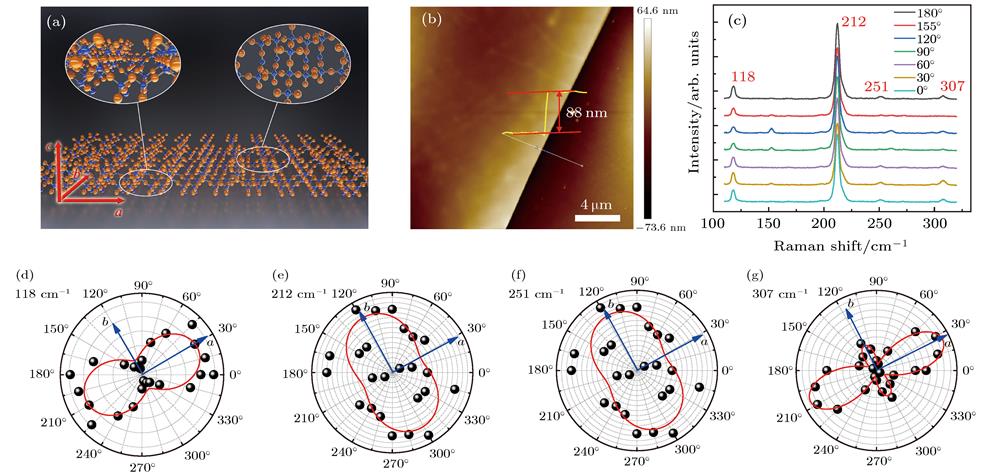
Fig. 1. (a) Schematic diagram of the atomic structure of GeSe2; (b) AFM image of GeSe2 flake by mechanical exfoliation. The thickness of the sample is 88 nm; (c) polarization-dependent Raman spectrum. Four Raman peak positions are at 118, 212, 251, 307 cm–1, respectively; (d)–(g) polar diagrams of the intensity of the four Raman peaks.
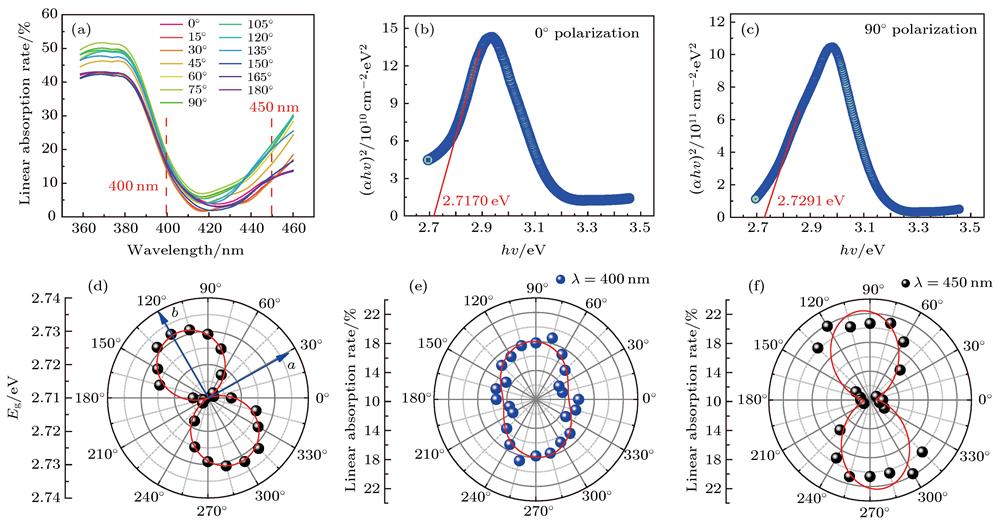
Fig. 2. Characterization of anisotropic bands of layered GeSe2 by linear absorption spectrum: (a) Linear absorption spectrum with polarization directions from 0° to 180° with intervals of 15°; (b) the energy band of the 0° polarization direction is determined. The band position obtained indirectly from Tauc’s theorem, where the position of the intersection of the tangent and the abscissa is 2.717 eV; (c) determination of the energy band of the 90° polarization direction. The band position obtained indirectly from Tauc’s theorem, where the position of the intersection of the tangent and the abscissa is 2.7291 eV; (d) anisotropic energy bands of layered GeSe2. The band gap in the b -axis direction is the largest, and the band gap in the a -axis direction is the smallest; (e) polar graph of anisotropic linear absorptivity of layered GeSe2 at 400 nm; (f) polar graph of anisotropic linear absorption of layered GeSe2 at 450 nm.
Fig. 3. Experimental results of superposition state absorption of different polarization directions under 400 nm non-resonant excitation: (a) Results of the I-scan experiment. The circles indicate the experimental data, and the solid lines indicate the excited state absorption curve; (b) polarization-dependent non-linear modulation depth polar plot; (c) polar plot of the change in polarization-dependent linear absorption coefficient α 0; (d) polarization diagram of polarization-dependent saturated absorption intensity I 1,s; (e) polarization diagram of the polarization-dependent excited state absorption coefficient β 0; (f) polarized graph of polarization-dependent saturation light intensity I 2,s absorbed by the excited state.
Fig. 4. Experimental results of superposition state absorption of different polarization directions under 450 nm non-resonant excitation: (a) Results of the I-scan experiment. The circles indicate the experimental data, and the solid lines indicate the excited state absorption curve: (b) polarization-dependent non-linear modulation depth polar plot: (c) polar plot of the change in polarization-dependent linear absorption coefficient α 0; (d) polarization diagram of polarization-dependent saturated absorption intensity I 1,s; (e) polarization diagram of the polarization-dependent excited state absorption coefficient β 0; (f) polarized graph of polarization-dependent saturation light intensityI 2,s absorbed by the excited state.
Fig. 5. Schematic diagram of GeSe2 based polarized-dependent all-optical switching
|
Table 1.
Fitting results of I-scan nonlinear superposition state absorption parameters related to 400 nm non-resonant excitation polarization
400 nm非共振激发偏振相关的I扫描非线性叠加态吸收参数的拟合结果
|
Table 2.
Fitting results of I-scan nonlinear superposition state absorption parameters related to 450 nm non-resonant excitation polarization
450 nm近共振激发偏振相关的I扫描非线性叠加态吸收参数的拟合结果

Set citation alerts for the article
Please enter your email address
© Copyright 2018-2021 | Chinese Laser Press. All Rights Reserved 沪ICP备15018463号-20