• High Power Laser Science and Engineering
  • Vol. 8, Issue 1, 010000e4 (2020)
Zongxin Zhang1, Fenxiang Wu1, Jiabing Hu1、2, Xiaojun Yang1, Jiayan Gui1, Penghua Ji3, Xingyan Liu3, Cheng Wang1, Yanqi Liu1, Xiaoming Lu1, Yi Xu1, Yuxin Leng1, Ruxin Li1、3, and Zhizhan Xu1
Author Affiliations
  • 1State Key Laboratory of High Field Laser Physics, Shanghai Institute of Optics and Fine Mechanics, Chinese Academy of Sciences, Shanghai201800, China
  • 2University of Chinese Academy of Sciences, Beijing100049, China
  • 3ShanghaiTech University, Shanghai201210, China
  • show less
    DOI: 10.1017/hpl.2020.3 Cite this Article Set citation alerts
    Zongxin Zhang, Fenxiang Wu, Jiabing Hu, Xiaojun Yang, Jiayan Gui, Penghua Ji, Xingyan Liu, Cheng Wang, Yanqi Liu, Xiaoming Lu, Yi Xu, Yuxin Leng, Ruxin Li, Zhizhan Xu. The 1 PW/0.1 Hz laser beamline in SULF facility[J]. High Power Laser Science and Engineering, 2020, 8(1): 010000e4 Copy Citation Text show less
    The layout of the SULF[15].
    Fig. 1. The layout of the SULF[15].
    Schematic diagram of the SULF-1 PW beamline.
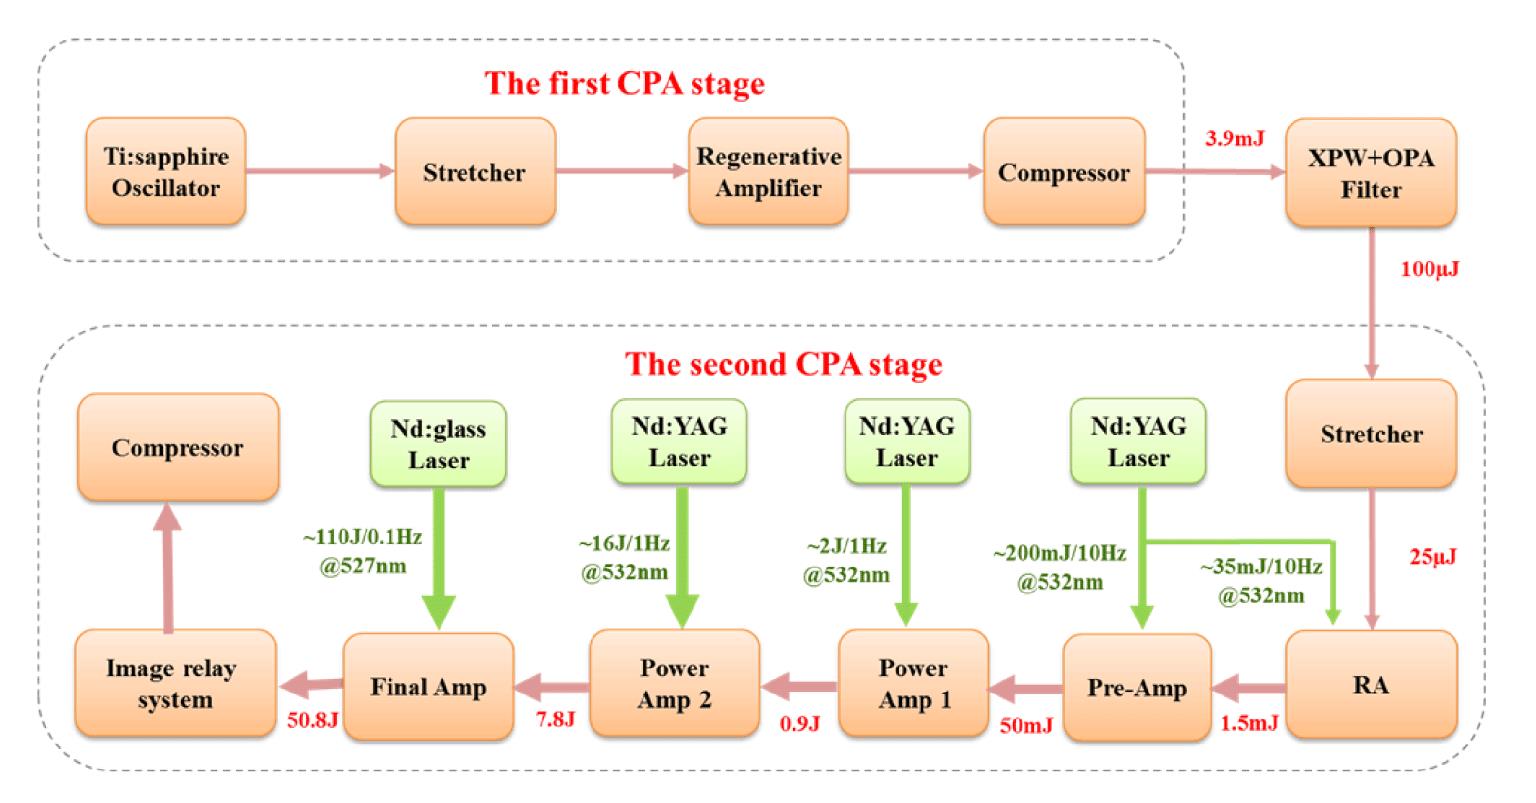
    Fig. 2. Schematic diagram of the SULF-1 PW beamline.
    Schematic of the grating compressor with a vacuum chamber.
    Fig. 3. Schematic of the grating compressor with a vacuum chamber.
    Shot-to-shot energy fluctuation of the amplified pulses. The inset shows the beam profile measured at the output of the Final Amp.
    Fig. 4. Shot-to-shot energy fluctuation of the amplified pulses. The inset shows the beam profile measured at the output of the Final Amp.
    Measured spectra after the RA (black thin solid line), the Pre-Amp (red dashed line), the Power Amp 1 (green dot-dashed line), the Power Amp 2 (blue dotted line) and the Final Amp (magenta thick solid line).
    Fig. 5. Measured spectra after the RA (black thin solid line), the Pre-Amp (red dashed line), the Power Amp 1 (green dot-dashed line), the Power Amp 2 (blue dotted line) and the Final Amp (magenta thick solid line).
    The duration and spectral phase of the compressed pulse.
    Fig. 6. The duration and spectral phase of the compressed pulse.
    The focal spot measured in SULF-1 PW beamline (a) before and (b), (c) after optimization of the grating compressor by using $f/26.5~\text{OAP}$.
    Fig. 7. The focal spot measured in SULF-1 PW beamline (a) before and (b), (c) after optimization of the grating compressor by using $f/26.5~\text{OAP}$.
    Temporal contrast of the compressed pulses.
    Fig. 8. Temporal contrast of the compressed pulses.
    Beam pointing stability measured after the compressor.
    Fig. 9. Beam pointing stability measured after the compressor.
    Zongxin Zhang, Fenxiang Wu, Jiabing Hu, Xiaojun Yang, Jiayan Gui, Penghua Ji, Xingyan Liu, Cheng Wang, Yanqi Liu, Xiaoming Lu, Yi Xu, Yuxin Leng, Ruxin Li, Zhizhan Xu. The 1 PW/0.1 Hz laser beamline in SULF facility[J]. High Power Laser Science and Engineering, 2020, 8(1): 010000e4
    Download Citation