
Xiuquan Ma, Libo Wang, Zhengwu Zhu, Chunming Wang, Gaoyang Mi. Microstructure of Recast Layer During High Power Laser Cutting of Thick Plates[J]. Chinese Journal of Lasers, 2023, 50(4): 0402015
- Chinese Journal of Lasers
- Vol. 50, Issue 4, 0402015 (2023)
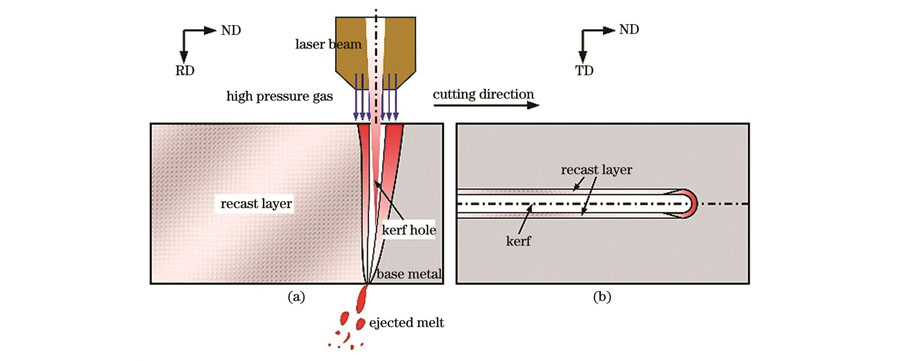
Fig. 1. Schematics for laser cutting. (a) Front view; (b) top view
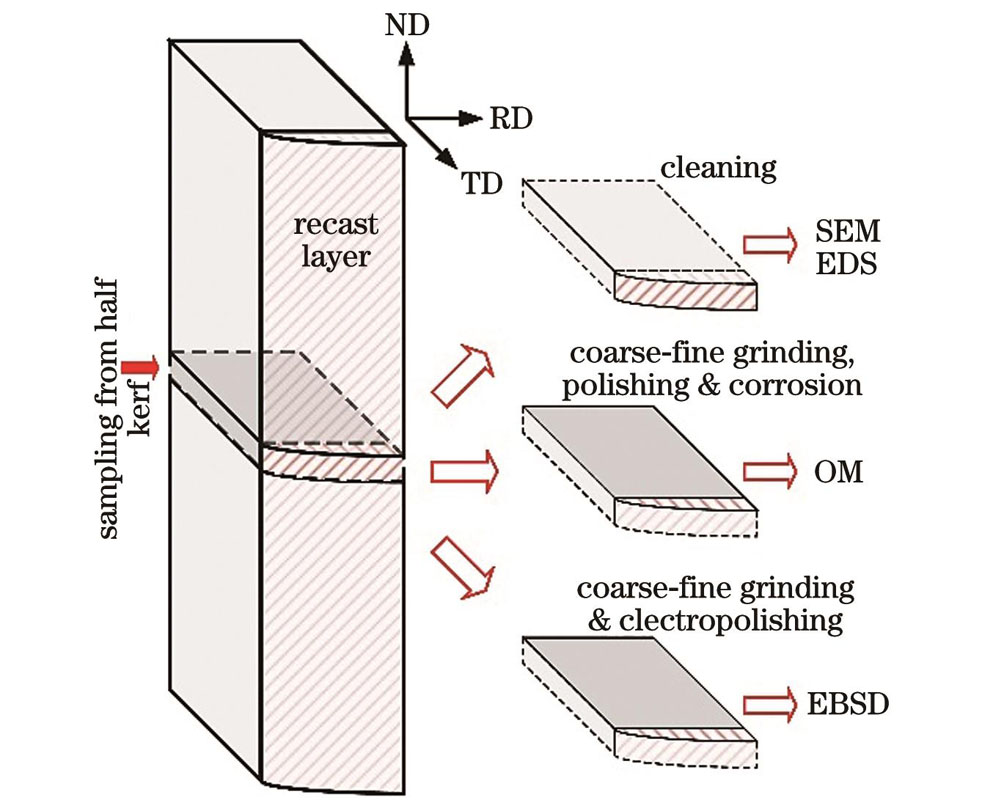
Fig. 2. Sampling, preparation and characterization of microstructure in the kerf
Fig. 3. Morphology of recast layer at different sites. (a)-(b) Kerf top; (c)-(e) at 1/3 site from kerf top; (f)-(g) at 2/3 site from kerf top; (h)-(j) kerf bottom
Fig. 4. Grain growth mode of recast layer. (a) At 1/3 site from kerf top; (b) kerf bottom
Fig. 5. Crystal orientation of recast layer at 1/3 site from kerf top. (a) Phase map; (b) IPF orientation figure derived from TD; (c) {1 0 0} pole figures of δ and γ phases in resolidified zone (RZ) and base material (BM)
Fig. 6. Grain size at 1/3 site from kerf top. (a) Grain size map; (b) grain size profiles of δ and γ phases in BM; (c) grain size profiles of δ and γ phases in RZ
Fig. 7. Crystal orientation at kerf bottom. (a) Phase map; (b) IPF orientation figure derived from TD; (c) {1 0 0} pole figures of δ and γ phases in RZ and BM
Fig. 8. Grain size at kerf bottom. (a) Grain size map; (b) grain size profiles of δ and γ phases in BM; (c) grain size profiles of δ and γ phases in RZ
Fig. 9. IPF orientation figures derived from TD with pole figures of BM and RZ at 1/3 site from kerf top. (a) δ phase; (b) γ phase
Fig. 10. IPF orientation figures derived from TD with pole figures of BM and RZ at kerf bottom. (a) δ phase; (b) γ phase
|
Table 1. Chemical composition of base metal
|
Table 2. Laser cutting parameters
|
Table 3. Phase parameters in electron back scattering diffraction (EBSD) tests
|
Table 4. Main results derived from EBSD postprocessing
| |||||||||||||||||||||||||||||||||||||||||
Table 5. Composition variation of recast layer along thickness direction
| |||||||||||||||||||||||||||||||||||||||
Table 6. Spatial coordinates of pole points in pole figures shown in Fig. 5
| ||||||||||||||||||||||||||||||||||||||||||||||||||||||
Table 7. Spatial coordinates of pole points in pole figures shown in Fig. 7

Set citation alerts for the article
Please enter your email address
© Copyright 2018-2021 | Chinese Laser Press. All Rights Reserved 沪ICP备15018463号-20