
Yarui WU, Hu WANG, Meijing WANG. Spatio-temporal variation and impact factors of tropospheric NO2 column density in Shaanxi-Gansu-Ningxia region based on OMI satellite data[J]. Journal of Atmospheric and Environmental Optics, 2023, 18(6): 553
- Journal of Atmospheric and Environmental Optics
- Vol. 18, Issue 6, 553 (2023)
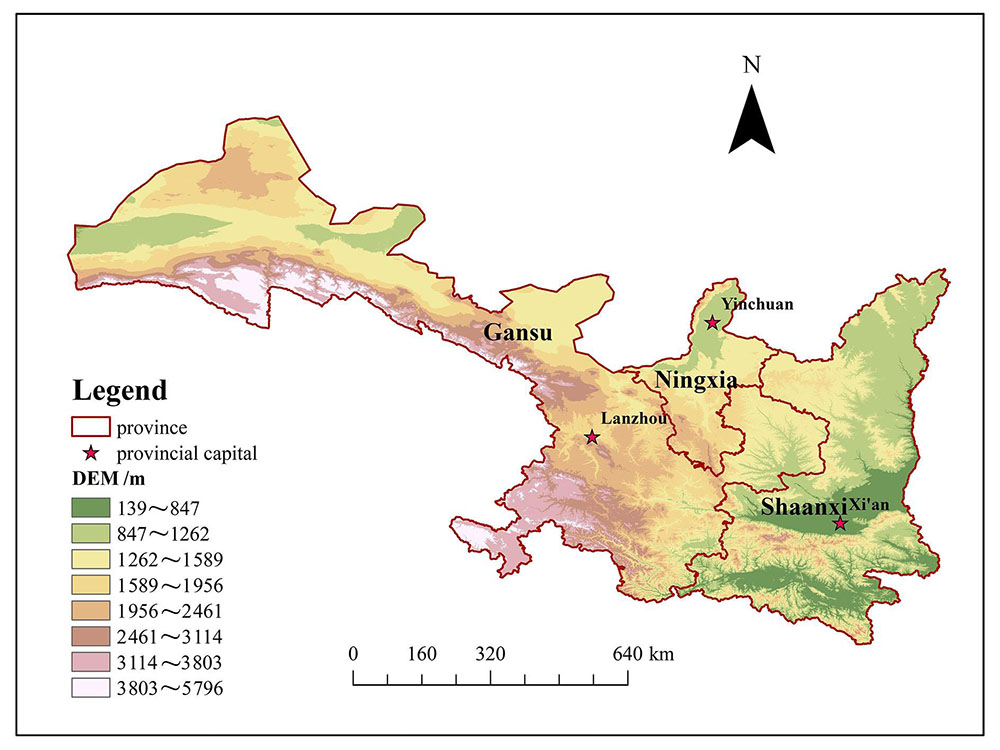
Fig. 1. Study area
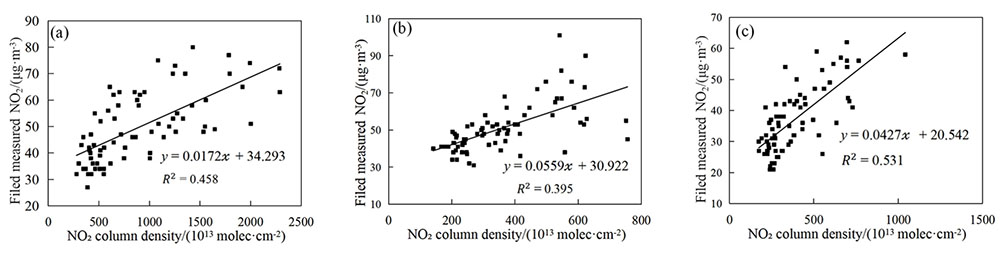
Fig. 2. Linear fitting between ground measured NO2 and OMI NO2 in major cities of Shaanxi-Gansu-Ningxia region from 2014 to 2019. (a) Xi'an; (b) Lanzhou; (c) Yinchuan
Fig. 3. Monthly average value of NO2 column density in Shaanxi-Gansu-Ningxia region from 2005 to 2019
Fig. 4. Seasonal variation of NO2 column density in Shaanxi-Gansu-Ningxia region from 2005 to 2019
Fig. 5. Seasonal average NO2 column density of Shaanxi-Gansu-Ningxia region during 2005 to 2019. (a) Spring; (b) summer; (c) autumn; (d) winter
Fig. 6. Annual variation trend of NO2 column density in Shaanxi-Gansu-Ningxia region from 2005 to 2019
Fig. 7. Spatial distribution of annual mean concentration of NO2 column density in Shaanxi-Gansu-Ningxia region from 2005 to 2019
Fig. 8. Seasonal wind direction and frequency maps of Shaanxi (a), Gansu (b) and Ningxia (c)
Fig. 9. Relationship between monthly average temperature and NO2 column density in Shaanxi-Gansu-Ningxia region from 2005 to 2019. (a) Scatter diagram; (b) trend graph
Fig. 10. Relationship between monthly average precipitation and NO2 column density in Shaanxi-Gansu-Ningxia region from 2005 to 2019. (a) Scatter diagram; (b) trend graph
Fig. 11. Variation tendency of economic indicators in Shaanxi-Gansu-Ningxia region from 2005 to 2018
| ||||||||||||||||||||||||||||||||||||||||||||||||||||||
Table 1. NOx emissions statistics of Shaanxi-Gansu-Ningxia region
| |||||||||||||||||||||||||||
Table 2. Correlation coefficient between NO2 column density and anthropogenic factors in various years


Set citation alerts for the article
Please enter your email address

© Copyright 2018-2021 | Chinese Laser Press. All Rights Reserved 沪ICP备15018463号-20