Author Affiliations
1Business school of Central South University, Changsha 410083, China2Institute of Metal Resources Strategy, Central South University, Changsha 410083, Chinashow less
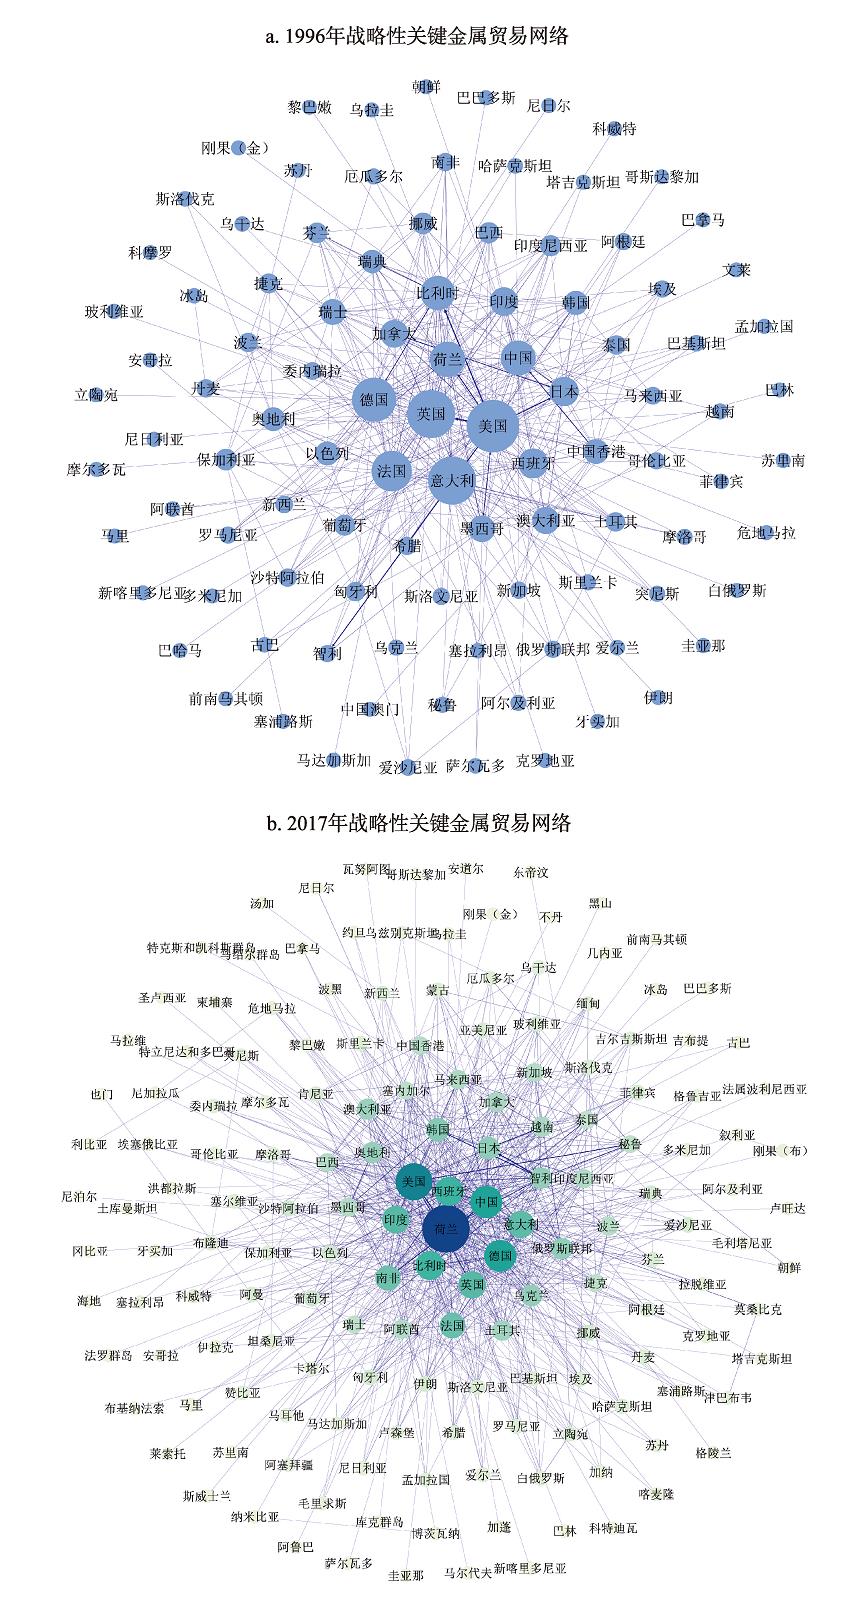
Fig. 1. Global strategic and critical metals trade network, 1996 and 2017
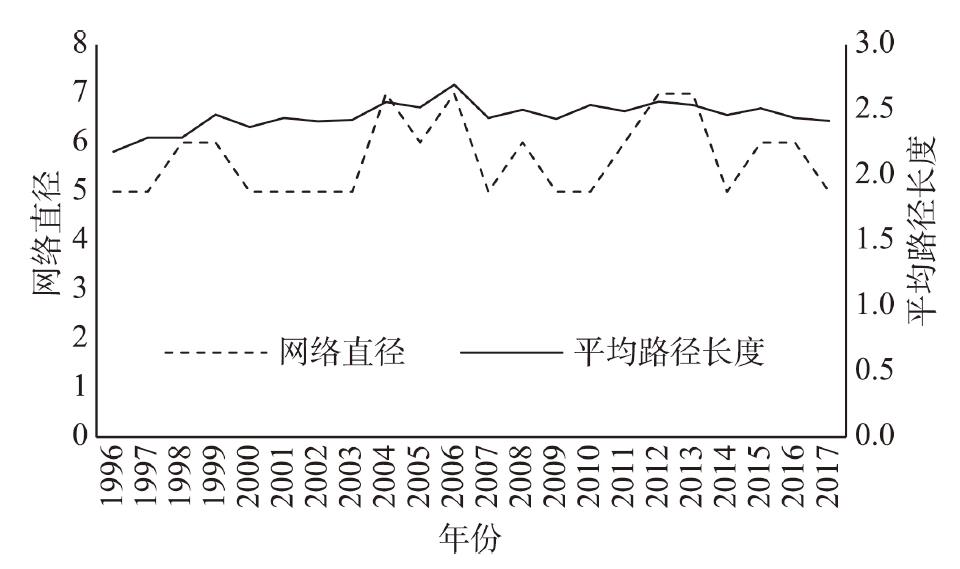
Fig. 2. Diameter and average path length of the global strategic and critical metals trade network, 1996-2017
Fig. 3. Density and average clustering coefficient of the global strategic and critical metals trade network, 1996-2017
Fig. 4. Annual non-agricultural output value increase (% of GDP) and scatter plots of various centrality indicators
| 年份 | 1996 | 2001 | 2006 | 2011 | 2017 |
|---|
| 节点数/个 | 105 | 130 | 152 | 155 | 171 | | 边数/条 | 509 | 761 | 857 | 982 | 1069 |
|
Table 1. The number of nodes and edges of the global strategic and critical metals trade network, 1996-2017
| 指标 | 入度中心度 | | 出度中心度 | | 接近中心度 | | 中间中心度 | | 特征向量中心度 |
|---|
| 排名 | 1 | 2 | 3 | 1 | 2 | 3 | 1 | 2 | 3 | 1 | 2 | 3 | 1 | 2 | 3 |
|---|
| 1996 | 日本 | 英国 | 比利时 | | 美国 | 澳大利亚 | 比利时 | | 厄瓜多尔 | 土耳其 | 丹麦 | | 美国 | 意大利 | 德国 | | 德国 | 美国 | 意大利 | | 1998 | 日本 | 荷兰 | 英国 | 美国 | 智利 | 澳大利亚 | 丹麦 | 圭亚那 | 坦桑尼亚 | 美国 | 德国 | 意大利 | 美国 | 德国 | 英国 | | 2000 | 日本 | 荷兰 | 美国 | 美国 | 中国 | 智利 | 约旦 | 坦桑尼亚 | 丹麦 | 美国 | 南非 | 意大利 | 美国 | 中国 | 德国 | | 2002 | 荷兰 | 日本 | 英国 | 智利 | 中国 | 美国 | 沙特阿拉伯 | 卡塔尔 | 塞尔维亚和黑山 | 美国 | 中国 | 英国 | 中国 | 英国 | 印度 | | 2004 | 荷兰 | 日本 | 智利 | 智利 | 中国 | 秘鲁 | 毛里求斯 | 突尼斯 | 克罗地亚 | 美国 | 德国 | 南非 | 中国 | 美国 | 德国 | | 2006 | 荷兰 | 日本 | 比利时 | 智利 | 美国 | 中国 | 毛里求斯 | 立陶宛 | 洪都拉斯 | 美国 | 印度 | 中国 | 中国 | 美国 | 德国 | | 2008 | 荷兰 | 日本 | 智利 | 智利 | 美国 | 秘鲁 | 立陶宛 | 斐济 | 毛里求斯 | 美国 | 印度 | 中国 | 中国 | 美国 | 德国 | | 2010 | 荷兰 | 日本 | 中国 | 智利 | 美国 | 中国 | 孟加拉国 | 斯洛文尼亚 | 阿拉伯联合酋长国 | 美国 | 南非 | 中国 | 中国 | 印度 | 美国 | | 2012 | 荷兰 | 日本 | 中国 | 美国 | 智利 | 中国 | 布隆迪 | 巴林 | 斐济 | 中国 | 美国 | 意大利 | 中国 | 美国 | 德国 | | 2014 | 荷兰 | 日本 | 美国 | 美国 | 智利 | 墨西哥 | 沙特阿拉伯 | 埃及 | 贝宁 | 中国 | 美国 | 德国 | 中国 | 美国 | 日本 | | 2016 | 荷兰 | 日本 | 中国 | 智利 | 美国 | 南非 | 新西兰 | 布基纳法索 | 巴拿马 | 中国 | 美国 | 荷兰 | 中国 | 荷兰 | 美国 | | 2017 | 日本 | 中国 | 芬兰 | 智利 | 美国 | 南非 | 阿曼 | 博茨瓦纳 | 尼加拉瓜 | 荷兰 | 美国 | 中国 | 中国 | 美国 | 印度 |
|
Table 2. Top three countries (region) of the global strategic and critical metals trade network in terms of centrality, 1996-2017
| 国家 | 入度中心度 | 出度中心度 | 接近中心度 | 中间中心度 | 特征向量中心度 | 收入组别 |
|---|
| 中国 | 3 | 3 | 5 | 2 | 1 | 低收入组 | | 美国 | 4 | 2 | 1 | 1 | 2 | 高收入组 | | 德国 | 8 | 12 | 2 | 3 | 3 | 高收入组 | | 日本 | 2 | 25 | 12 | 13 | 4 | 高收入组 | | 印度 | 14 | 14 | 9 | 5 | 5 | 低收入组 | | 荷兰 | 1 | 5 | 6 | 6 | 6 | 高收入组 | | 英国 | 7 | 24 | 4 | 7 | 7 | 高收入组 | | 意大利 | 10 | 10 | 3 | 4 | 8 | 高收入组 | | 韩国 | 6 | 13 | 19 | 28 | 9 | 高收入组 | | 法国 | 18 | 30 | 8 | 10 | 10 | 高收入组 |
|
Table 3. Ranking of countries (regions) in the global strategic and critical metals trade network in terms of average centrality (Top10), 1996-2017
| 产业结构(1) | 产业结构(2) | 产业结构(3) | 产业结构(4) | 产业结构(5) |
|---|
| 接近中心度(标准化) | 0.00622*** | | | | | | (0.00200) | | | | | | 中间中心度(标准化) | | 0.0275*** | | | | | | (0.00904) | | | | | 特征向量中心度(标准化) | | | -0.00479 | | | | | | (0.00499) | | | | 入度中心度(标准化) | | | | 0.00699 | | | | | | (0.00750) | | | 出度中心度(标准化) | | | | | 0.00575 | | | | | | (0.00754) | | 外商直接投资占GDP比重 | 0.0254*** | 0.0242*** | 0.0251*** | 0.0235*** | 0.0248*** | | (0.00743) | (0.00744) | (0.00745) | (0.00768) | (0.00748) | | 城镇人口占总人口比重 | -0.0525*** | -0.0644*** | -0.0534*** | -0.0572*** | -0.0539*** | | (0.0190) | (0.0193) | (0.0190) | (0.0196) | (0.0191) | | 高技术产品出口占制成品出口比重 | -0.00106 | -0.00331 | -0.00213 | -0.00270 | -0.00272 | | (0.00806) | (0.00805) | (0.00808) | (0.00807) | (0.00807) | | 第二、三产业就业占比 | 0.112*** | 0.109*** | 0.111*** | 0.112*** | 0.111*** | | (0.0211) | (0.0211) | (0.0212) | (0.0212) | (0.0212) | | log(人均GDP) | 0.205*** | 0.213*** | 0.216*** | 0.214*** | 0.213*** | | (0.0177) | (0.0176) | (0.0178) | (0.0177) | (0.0176) | | log(人均GDP)2 | -0.0218*** | -0.0228*** | -0.0231*** | -0.0230*** | -0.0228*** | | (0.00225) | (0.00223) | (0.00226) | (0.00224) | (0.00224) | | 私营部门的国内信贷占GDP比重 | 0.00683*** | 0.00656*** | 0.00681*** | 0.00698*** | 0.00696*** | | (0.00209) | (0.00209) | (0.00210) | (0.00209) | (0.00210) | | 常量 | 0.400*** | 0.395*** | 0.381*** | 0.385*** | 0.386*** | | (0.0293) | (0.0290) | (0.0294) | (0.0290) | (0.0290) | | 豪斯曼检验(chi2) | 62.76 | 78.96 | 62.89 | 62.27 | 63.36 | | Prob>chi2 | 0.0000 | 0.0000 | 0.0000 | 0.0000 | 0.0000 | | 模型 | 固定效应 | 固定效应 | 固定效应 | 固定效应 | 固定效应 | | R2 | 0.9412 | 0.9411 | 0.9408 | 0.9408 | 0.9408 | | 调整后的R2 | 0.9380 | 0.9380 | 0.9376 | 0.9376 | 0.9376 | | F统计量 | 301.01 | 300.90 | 298.92 | 298.91 | 298.84 | | Prob>F | 0.0000 | 0.0000 | 0.0000 | 0.0000 | 0.0000 | | 观测量 | 1408 | 1408 | 1408 | 1408 | 1408 |
|
Table 4. Overall regression results
| 产业结构(1) | 产业结构(2) | 产业结构(3) | 产业结构(4) | 产业结构(5) |
|---|
| 接近中心度(标准化) | 0.00329** | | | | | | (0.00138) | | | | | | 中间中心度(标准化) | | 0.00549 | | | | | | (0.00600) | | | | | 特征向量中心度(标准化) | | | 0.00183 | | | | | | (0.00337) | | | | 入度中心度(标准化) | | | | -0.00372 | | | | | | (0.00418) | | | 出度中心度(标准化) | | | | | 0.00426 | | | | | | (0.00443) | | 外商直接投资占GDP比重 | 0.0196*** | 0.0194*** | 0.0196*** | 0.0205*** | 0.0192*** | | (0.00403) | (0.00405) | (0.00404) | (0.00417) | (0.00405) | | 城镇人口占总人口比重 | 0.0417** | 0.0395** | 0.0436*** | 0.0470*** | 0.0412** | | (0.0164) | (0.0167) | (0.0165) | (0.0172) | (0.0165) | | 高技术产品出口占制成品出口比重 | -0.00681 | -0.00785 | -0.00795 | -0.00793 | -0.00787 | | (0.00660) | (0.00661) | (0.00661) | (0.00661) | (0.00661) | | 第二、三产业就业占比 | 0.122*** | 0.123*** | 0.123*** | 0.121*** | 0.126*** | | (0.0268) | (0.0269) | (0.0269) | (0.0271) | (0.0270) | | log(人均GDP) | 0.0579** | 0.0627** | 0.0593** | 0.0608** | 0.0591** | | (0.0246) | (0.0247) | (0.0248) | (0.0247) | (0.0247) | | log(人均GDP)2 | -0.00524* | -0.00584** | -0.00543* | -0.00559* | -0.00543* | | (0.00291) | (0.00293) | (0.00293) | (0.00292) | (0.00292) | | 私营部门的国内信贷占GDP比重 | 0.00520*** | 0.00527*** | 0.00544*** | 0.00533*** | 0.00525*** | | (0.00126) | (0.00126) | (0.00128) | (0.00126) | (0.00127) | | 常量 | 0.628*** | 0.621*** | 0.623*** | 0.619*** | 0.625*** | | (0.0527) | (0.0528) | (0.0529) | (0.0529) | (0.0529) | | 豪斯曼检验(chi2) | 16.94 | 15.60 | 19.74 | 17.12 | 16.46 | | Prob>chi2 | 0.0308 | 0.0484 | 0.0114 | 0.0289 | 0.0362 | | 模型 | 固定效应 | 固定效应 | 固定效应 | 固定效应 | 固定效应 | | R2 | 0.8474 | 0.8464 | 0.8463 | 0.8464 | 0.8464 | | 调整后的R2 | 0.8386 | 0.8376 | 0.8375 | 0.8376 | 0.8376 | | F统计量 | 96.61 | 95.87 | 95.79 | 95.87 | 95.89 | | Prob>F | 0.0000 | 0.0000 | 0.0000 | 0.0000 | 0.0000 | | 观测量 | 792 | 792 | 792 | 792 | 792 |
|
Table 5. Regression results of the high income group
| 产业结构(1) | 产业结构(2) | 产业结构(3) | 产业结构(4) | 产业结构(5) |
|---|
| 接近中心度(标准化) | 0.00843** | | | | | | (0.00416) | | | | | | 中间中心度(标准化) | | 0.0474** | | | | | | (0.0210) | | | | | 特征向量中心度(标准化) | | | -0.00466 | | | | | | (0.0110) | | | | 入度中心度(标准化) | | | | 0.0302 | | | | | | (0.0344) | | | 出度中心度(标准化) | | | | | 0.0110 | | | | | | (0.0225) | | 外商直接投资占GDP比重 | 0.0359 | 0.0355 | 0.0317 | 0.0338 | 0.0319 | | (0.0362) | (0.0362) | (0.0364) | (0.0363) | (0.0364) | | 城镇人口占总人口比重 | -0.133*** | -0.152*** | -0.135*** | -0.143*** | -0.138*** | | (0.0335) | (0.0341) | (0.0337) | (0.0345) | (0.0337) | | 高技术产品出口占制成品出口比重 | 0.0133 | 0.00772 | 0.0129 | 0.0103 | 0.0117 | | (0.0147) | (0.0148) | (0.0148) | (0.0149) | (0.0148) | | 第二、三产业就业占比 | 0.128*** | 0.121*** | 0.127*** | 0.126*** | 0.126*** | | (0.0327) | (0.0328) | (0.0328) | (0.0328) | (0.0328) | | log(人均GDP) | 0.229*** | 0.221*** | 0.247*** | 0.241*** | 0.242*** | | (0.0427) | (0.0433) | (0.0428) | (0.0423) | (0.0423) | | log(人均GDP)2 | -0.0241*** | -0.0226*** | -0.0264*** | -0.0255*** | -0.0257*** | | (0.00605) | (0.00616) | (0.00610) | (0.00602) | (0.00603) | | 私营部门的国内信贷占GDP比重 | 0.00336 | 0.00328 | 0.00299 | 0.00329 | 0.00327 | | (0.00625) | (0.00624) | (0.00627) | (0.00628) | (0.00632) | | 常量 | 0.384*** | 0.413*** | 0.351*** | 0.369*** | 0.362*** | | (0.0741) | (0.0770) | (0.0745) | (0.0743) | (0.0738) | | 豪斯曼检验(chi2) | 39.28 | 46.89 | 40.06 | 40.68 | 41.24 | | Prob>chi2 | 0.0000 | 0.0000 | 0.0000 | 0.0000 | 0.0000 | | 模型 | 固定效应 | 固定效应 | 固定效应 | 固定效应 | 固定效应 | | R2 | 0.8791 | 0.8793 | 0.8783 | 0.8784 | 0.8783 | | 调整后的R2 | 0.8718 | 0.8720 | 0.8710 | 0.8711 | 0.8710 | | F统计量 | 120.53 | 120.76 | 119.61 | 119.74 | 119.62 | | Prob>F | 0.0000 | 0.0000 | 0.0000 | 0.0000 | 0.0000 | | 观测量 | 616 | 616 | 616 | 616 | 616 |
|
Table 6. Regression results of the low income group