
Chun-Xiang Guo, Zhi-Hong Jiao, Xiao-Xin Zhou, Peng-Cheng Li. Mechanism of laser intensity-dependent below-threshold harmonic generation [J]. Acta Physica Sinica, 2020, 69(7): 074203-1
- Acta Physica Sinica
- Vol. 69, Issue 7, 074203-1 (2020)
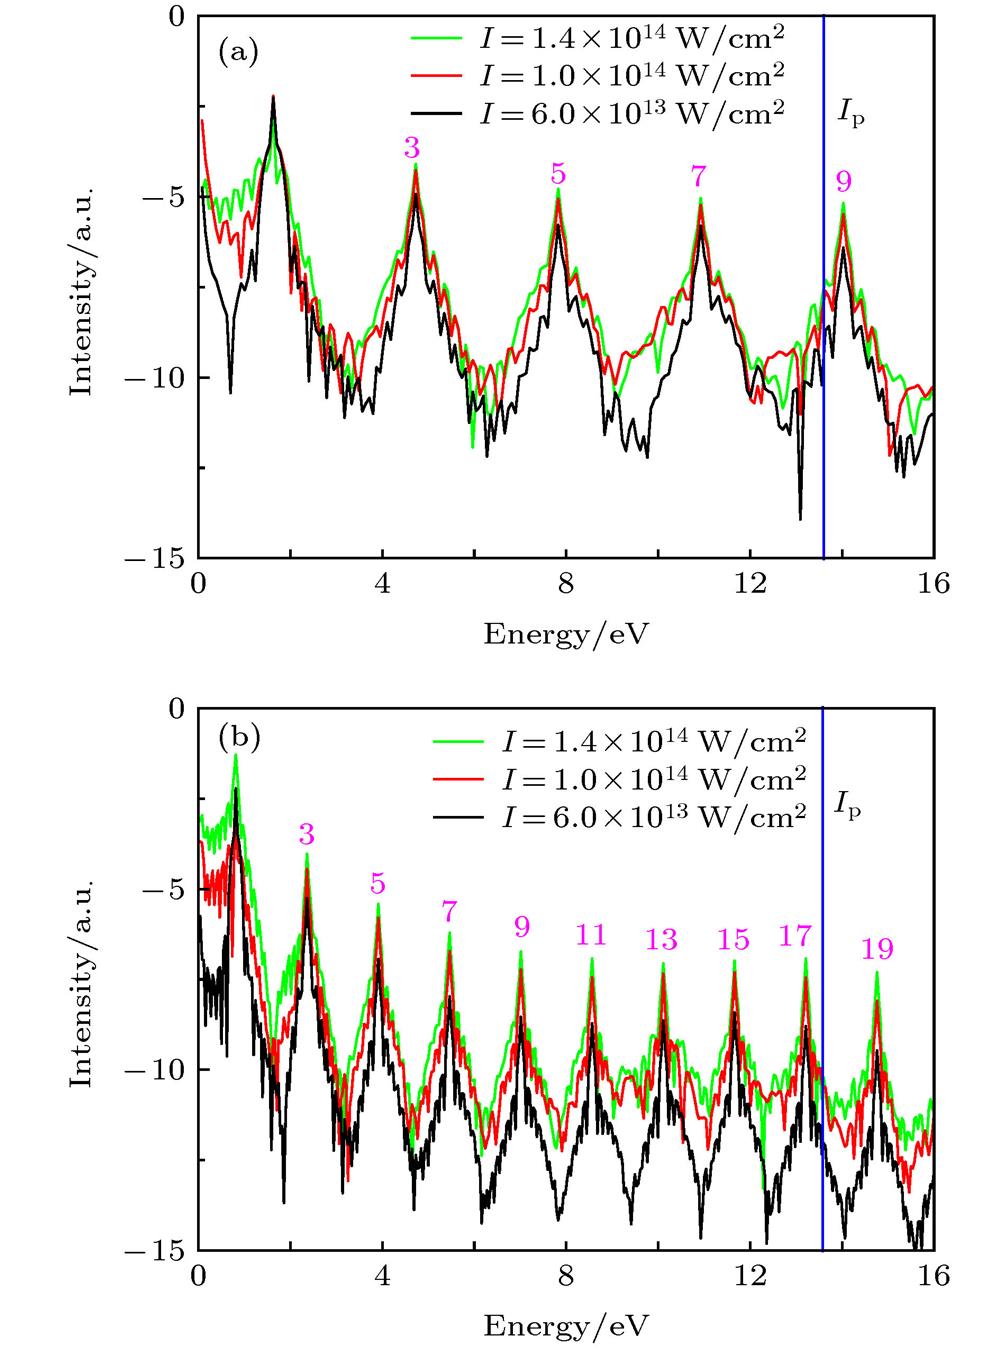
Fig. 1. The HHG spectra produced by the hydrogen atom below the ionization threshold: (a) The wavelength is
 , and the intensity is
 (black solid line),
 (red solid line), and
 (green solid line), the blue lines indicate the ionization energy
 I p of hydrogen atom; (b) same as (a), the wavelength is
 case.
case.
, and the intensity is
(black solid line),
(red solid line), and
(green solid line), the blue lines indicate the ionization energy case. 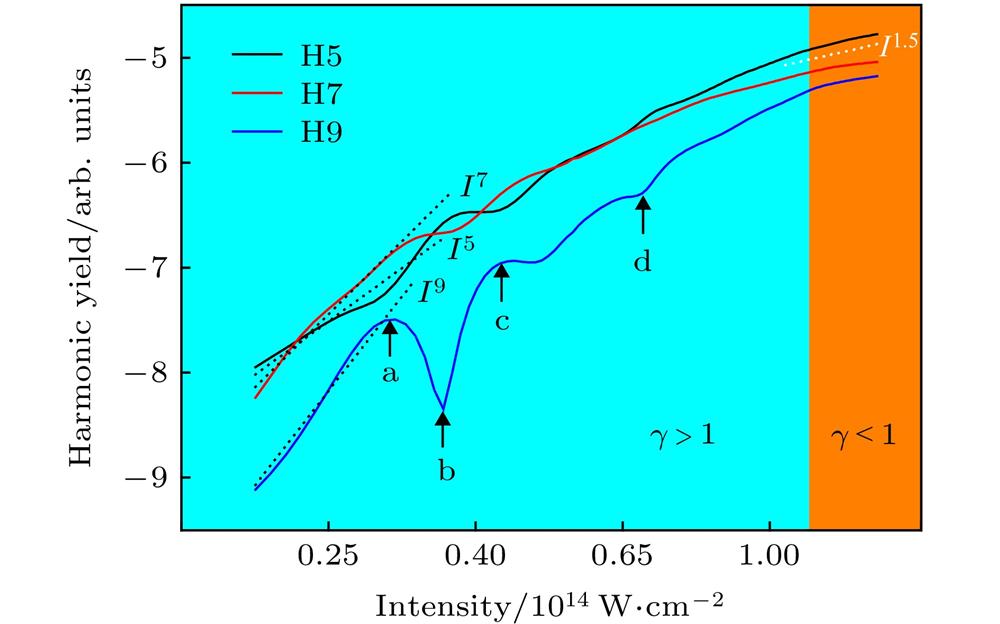
Fig. 2. The peak intensity of H5(black solid line), H7(red line), and H9 (blue solid line) below the ionization threshold as a function of the laser field intensity. Here, the wavelength is
 , and the other laser field parameters used are the same as those in
 Fig. 1(a) . The arrows a, b, c, and d indicate the peak intensity of H9 at the intensity
 of
of
 ,
,
 ,
,

 , and 6.6 ×

 , respectively.
, and the other laser field parameters used are the same as those in of
,
,
, and 6.6 ×
, respectively. Fig. 3. The time-dependent position of electrons at the given laser intensity shown in a, b, c, and d points in H9 curve. The red solid lines represent the laser field, the blue solid lines represent the trajectories of the electron, and the black dotted lines represent the position of the parent nucleus. The other laser field parameters used are the same as those in Fig. 2 .
Fig. 4. Time-frequency analysis of below-threshold harmonic generation with a
 wavelength: (a)
 ; (b)
; (b)
 ; (c)
; (c)
 ; (d)
; (d)
 .
.
wavelength: (a)
; (b)
; (c)
; (d)
. Fig. 5. Time-frequency analysis of below-threshold harmonic, in a
 laser wavelength with the intensity
 : (a) H5; (b) H7; (c) H9.
laser wavelength with the intensity
: (a) H5; (b) H7; (c) H9. Fig. 6. The distributions of the quantity channels as a function of the laser intensity for the below- threshold harmonics (The laser field parameters used are the same as those in Fig. 2 .): (a) H5; (b) H7; (c) H9.

Set citation alerts for the article
Please enter your email address
© Copyright 2018-2021 | Chinese Laser Press. All Rights Reserved 沪ICP备15018463号-20