
Yan-Xia Liu, Yun-Bo Zhang. Review of one-dimensional few-body systems in ultracold atomic physics [J]. Acta Physica Sinica, 2019, 68(4): 040304-1
- Acta Physica Sinica
- Vol. 68, Issue 4, 040304-1 (2019)
![The loss processes include two tunneling processes of two atoms out of a metastable potential: subsequent single-particle tunneling and direct pair tunneling (Reproduced with permission from Ref. [25]).双原子的两种隧穿过程: 单原子次序隧穿及两原子配对隧穿. 本图摘自参考文献[25]](/richHtml/wlxb/2019/68/4/20181993/img_1.jpg)
Fig. 1. The loss processes include two tunneling processes of two atoms out of a metastable potential: subsequent single-particle tunneling and direct pair tunneling (Reproduced with permission from Ref. [25]).
双原子的两种隧穿过程: 单原子次序隧穿及两原子配对隧穿. 本图摘自参考文献[25]
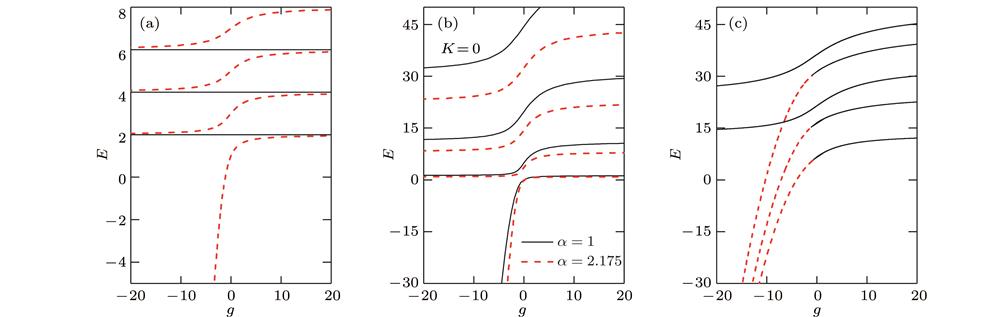
Fig. 2. Energy spectrum of three types of interacting two-atom system: (a)Two atoms in a harmonic oscillator potential. Black solid lines and red dashed lines are odd parity and even parity energy level respectively; (b)two heteronuclear atoms in a ring trap. Black solid lines and red dashed lines are energy levels for equal mass and mass ratio
= 2.175 respectively; (c) two atoms in a
-split hard-wall double well. Five lowest odd parity levels for barrier height d = 0.5. Black solid lines and red dashed lines are the bound states for atoms with real-valued quasimomentum and the molecule states with complex-valued quasimomentum respectively.
三种相互作用的两原子系统的能量E 与相互作用强度g 的关系: (a)谐振子势阱中的两原子, 黑实线和红虚线分别表示相对运动奇宇称和偶宇称波函数所对应的能量; (b)周期边界条件下两异核原子, 黑实线和红虚线分别表示质量相等两原子和质量比为2.175情况下对应的能量; (c)双势阱中相互作用两原子的奇宇称态, 一维无限深方势阱中心为一个强度为d = 0.5的
势垒劈开, 黑实线和红虚线分别表示准动量为实数的原子本征态和准动量为复数的分子态对应的能量. 这里能量的单位分别是
, 相互作用强度g 的单位分别是
Fig. 3. (a) Decay time
vs magnetic field B . The points with error bars are the experimental data[24], the dashed and solid lines are, respectively, the WKB
and QPWF predictions. The green light gray lines include the perturbation theory correction to the tunneling energy
; (b) interaction strength (red gray curve) and tunneling energy (black and green light gray curve) vs B (Reproduced with permission from Ref. [33]).
(a)衰减时间随磁场的变化. 黑色虚线和实线分别是WKB和考虑准粒子波动方程的修正的结果. 绿色线表示通过微扰论考虑非谐项贡献的结果; (b)相互作用强度和隧穿能量随磁场的变化.本图摘自参考文献[33]
Fig. 4. (a) Tunneling dynamics of the occupation probability
of finding both atoms in the same well for g = 0.5 (black solid line), g = 1.5 (blue dashed line), and g = 20 (red dotted line). The
barrier is abruptly lowered from a height d = 300 to 0.5 at time t = 0. (b) the two-body density functions
at different times t , for g = 1.5 and 20, respectively. Here the coordinates
and
are in units of
(Reproduced with permission from Ref. [98]).
(a)两个原子在同一个阱中的占据概率随时间的演化图. 黑实线, 蓝虚线, 红点线分别表示不同的相互作用强度g = 0.5, 1.5, 20. 在t = 0时刻势垒高度突然从d = 300降到d =0.5. (b)g = 1.5和20时一个周期里不同时刻的密度分布图, 这里坐标
和
的单位是
. 本图摘自参考文献[98]

Set citation alerts for the article
Please enter your email address
© Copyright 2018-2021 | Chinese Laser Press. All Rights Reserved 沪ICP备15018463号-20