• Chinese Optics Letters
  • Vol. 18, Issue 12, 121701 (2020)
Fei Duan1, Haosong Ma1, Jinde Zhang1, Shi Li1, Honghui Li1, Zhiyou Wu1, Fengqiu Hong1, Lüming Zeng2、3, and Liming Nie1、*
Author Affiliations
  • 1State Key Laboratory of Molecular Vaccinology and Molecular Diagnostics & Center for Molecular Imaging and Translational Medicine, School of Public Health, Xiamen University, Xiamen 361102, China
  • 2State Key Laboratory of Precision Electronic Manufacturing Technology and Equipment, School of Electromechanical Engineering, Guangdong University of Technology, Guangzhou 510006, China
  • 3Jiangxi Key Laboratory of Optic-Electronic and Communication, Jiangxi Science and Technology Normal University, Nanchang 330038, China
  • show less
    DOI: 10.3788/COL202018.121701 Cite this Article Set citation alerts
    Fei Duan, Haosong Ma, Jinde Zhang, Shi Li, Honghui Li, Zhiyou Wu, Fengqiu Hong, Lüming Zeng, Liming Nie. Optical-resolution photoacoustic microscopy continually monitors macrophages activities of acute inflammation in vivo[J]. Chinese Optics Letters, 2020, 18(12): 121701 Copy Citation Text show less
    OR-PAM system. (a) OR-PAM and MEMS-OR-PAM system scheme. (b) The ESF and LSF of a sharp edge.
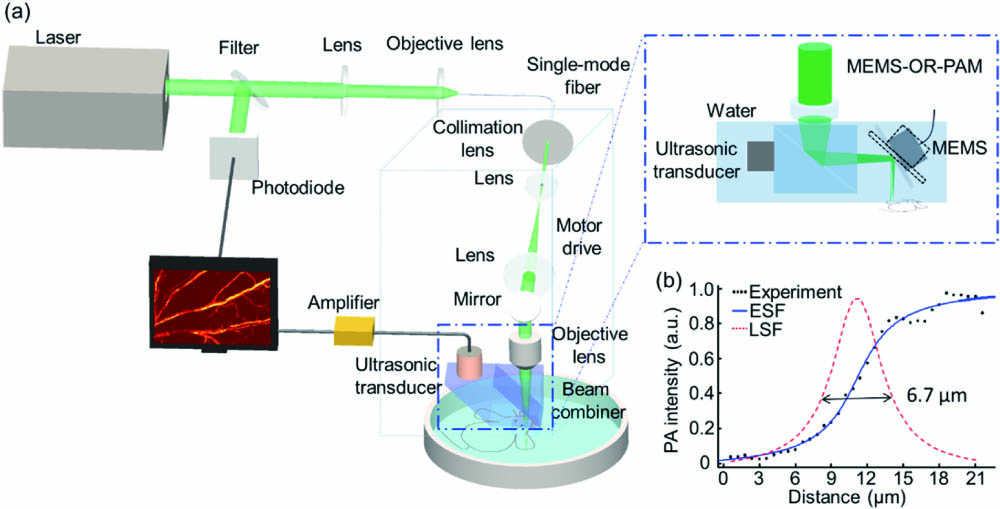
    Fig. 1. OR-PAM system. (a) OR-PAM and MEMS-OR-PAM system scheme. (b) The ESF and LSF of a sharp edge.
    Processing method of macrophage and vessel. (a) The optical microscopy images of labeled macrophages and macrophages. (b) The PA images of labeled macrophages, macrophages, and vessel by OR-PAM. (c) The PA intensities of labeled macrophages, macrophages background, and vessel. (d) The PA image of a normal mouse ear. (e) The PA image after the Hessian filter. (f) The centerline of the blood vessels. (g) The depth distribution of the PAM image. The scale bar is 500 μm. (h) The fluorescence images of normal and modeled mouse ears injected with macrophages.
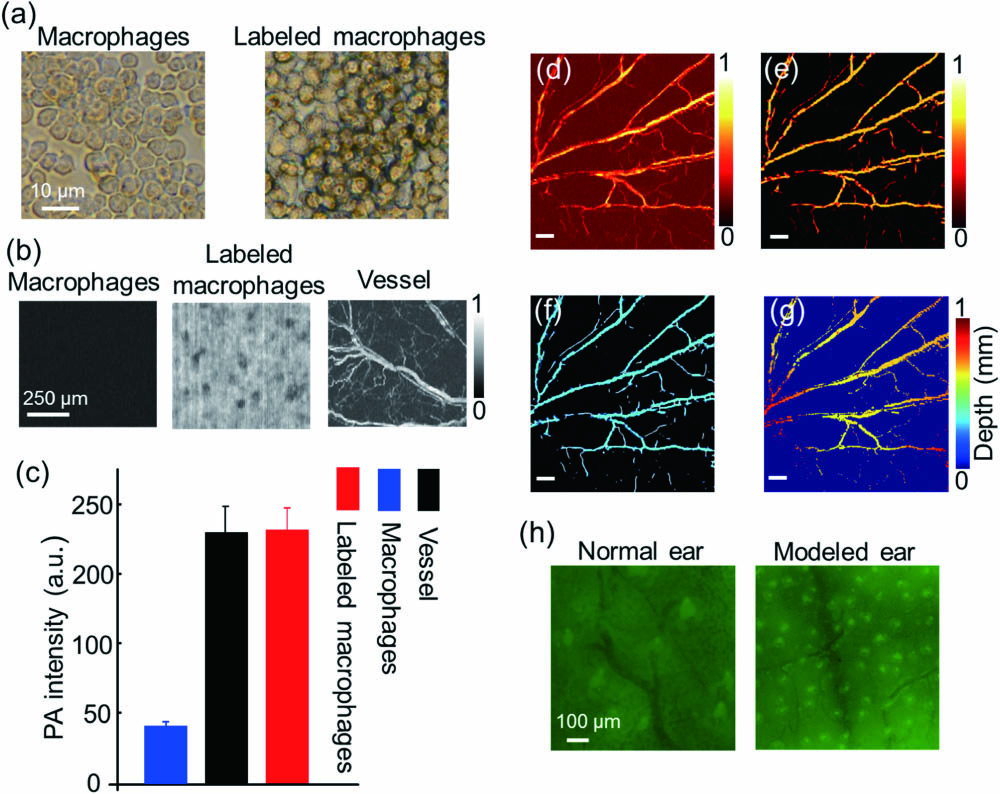
    Fig. 2. Processing method of macrophage and vessel. (a) The optical microscopy images of labeled macrophages and macrophages. (b) The PA images of labeled macrophages, macrophages, and vessel by OR-PAM. (c) The PA intensities of labeled macrophages, macrophages background, and vessel. (d) The PA image of a normal mouse ear. (e) The PA image after the Hessian filter. (f) The centerline of the blood vessels. (g) The depth distribution of the PAM image. The scale bar is 500 μm. (h) The fluorescence images of normal and modeled mouse ears injected with macrophages.
    Monitoring the vessel using OR-PAM. PA images of the (a) control group without modeling and macrophages, (b) normal mouse ear group injected with labeled macrophages, (c) modeled mouse ear group, and (d) modeled mouse ear group injected with labeled macrophages. (e) PA average intensity, (f) vessel density, (g) vessel ratio (the area of vessels signal/the area of the whole imaging), and (h) vessel average diameter of four groups. The white arrows point to the new vessels caused by inflammation, while the blue arrows represent labeled macrophages. The scale bar is 500 μm.
    Fig. 3. Monitoring the vessel using OR-PAM. PA images of the (a) control group without modeling and macrophages, (b) normal mouse ear group injected with labeled macrophages, (c) modeled mouse ear group, and (d) modeled mouse ear group injected with labeled macrophages. (e) PA average intensity, (f) vessel density, (g) vessel ratio (the area of vessels signal/the area of the whole imaging), and (h) vessel average diameter of four groups. The white arrows point to the new vessels caused by inflammation, while the blue arrows represent labeled macrophages. The scale bar is 500 μm.
    Monitoring the vessel changes by MEMS-OR-PAM through 20 min. (a) PA images of the modeled mouse ear group injected with macrophages in 20 min. (b) The images were obtained by subtracting the ear before modeling from the modeled ear injected with macrophages. The arrows represent the dispersion labeled macrophages. The scale bar is 500 μm.
    Fig. 4. Monitoring the vessel changes by MEMS-OR-PAM through 20 min. (a) PA images of the modeled mouse ear group injected with macrophages in 20 min. (b) The images were obtained by subtracting the ear before modeling from the modeled ear injected with macrophages. The arrows represent the dispersion labeled macrophages. The scale bar is 500 μm.
    Fei Duan, Haosong Ma, Jinde Zhang, Shi Li, Honghui Li, Zhiyou Wu, Fengqiu Hong, Lüming Zeng, Liming Nie. Optical-resolution photoacoustic microscopy continually monitors macrophages activities of acute inflammation in vivo[J]. Chinese Optics Letters, 2020, 18(12): 121701
    Download Citation