• Chinese Journal of Lasers
  • Vol. 49, Issue 20, 2007202 (2022)
Xiuli Wang1、2, Ruoxuan Du1, X.Steve Yao1、2, Ya Su1、2、3、*, Shengwei Cui1、2、3, Peng Hao1、2, Lijun Yang1, and Bingbing Duan1、2
Author Affiliations
  • 1College of Physics Science & Technology, Hebei University, Baoding 071002, Hebei, China
  • 2Hebei Provincial Center for Optical Sensing Innovations, Baoding 071002, Hebei, China
  • 3Institute of Life Science and Green Development, Hebei University, Baoding 071002, Hebei, China
  • show less
    DOI: 10.3788/CJL202249.2007202 Cite this Article Set citation alerts
    Xiuli Wang, Ruoxuan Du, X.Steve Yao, Ya Su, Shengwei Cui, Peng Hao, Lijun Yang, Bingbing Duan. Automatic Detection and Quantitative Analysis of Insect Cardiac Function Parameters Using OCT[J]. Chinese Journal of Lasers, 2022, 49(20): 2007202 Copy Citation Text show less
    Typical OCT images of locust embryo. (a) 3D projection image of locust embryo; 2D B-scan cross-sections of embryonic heart at (b) end of diastole and (c) end of systole
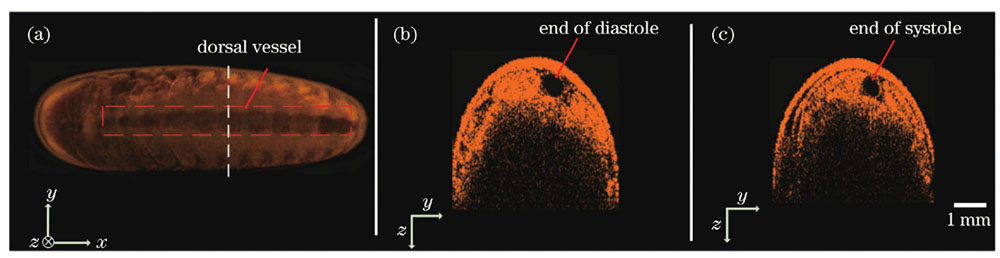
    Fig. 1. Typical OCT images of locust embryo. (a) 3D projection image of locust embryo; 2D B-scan cross-sections of embryonic heart at (b) end of diastole and (c) end of systole
    Flow chart of quantitative detection algorithm for cardiac function parameters
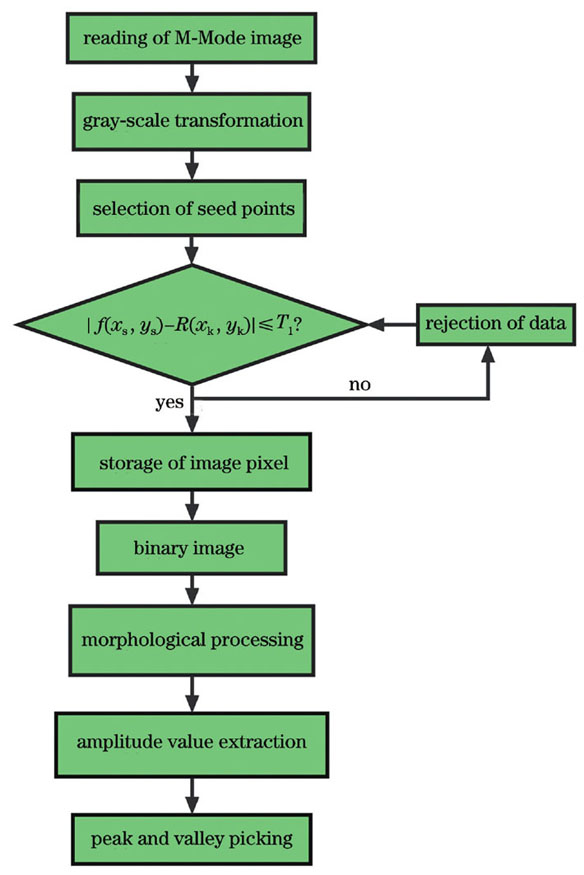
    Fig. 2. Flow chart of quantitative detection algorithm for cardiac function parameters
    OCT M-Mode images of 9-day locust embryo. (a) Original image before treatment; (b) M-Mode image after grayscale transformation; (c) M-Mode image after grayscale transformation added with seed point; (d) M-Mode image after threshold segmentation; (e) M-Mode image after morphologic processing; (f) amplitude image of locust embryonic heart; (g) extreme points obtained by peak value extraction from Fig. 3(f)
    Fig. 3. OCT M-Mode images of 9-day locust embryo. (a) Original image before treatment; (b) M-Mode image after grayscale transformation; (c) M-Mode image after grayscale transformation added with seed point; (d) M-Mode image after threshold segmentation; (e) M-Mode image after morphologic processing; (f) amplitude image of locust embryonic heart; (g) extreme points obtained by peak value extraction from Fig. 3(f)
    Heart rate of locust embryo
    Fig. 4. Heart rate of locust embryo
    Average maximum EDD and minimum ESD versus hatching time of locust embryonic heart
    Fig. 5. Average maximum EDD and minimum ESD versus hatching time of locust embryonic heart
    Calculation diagrams of maximum EDA and minimum ESA of locust embryonic heart. (a)(f) Original images; (b)(g) images after grayscale transformation; (c)(h) images added with seed point; (d)(i) result images after threshold segmentation; (e)(j) images after morphologic processing
    Fig. 6. Calculation diagrams of maximum EDA and minimum ESA of locust embryonic heart. (a)(f) Original images; (b)(g) images after grayscale transformation; (c)(h) images added with seed point; (d)(i) result images after threshold segmentation; (e)(j) images after morphologic processing
    Average maximum EDA and minimum ESA versus hatching time of locust embryonic heart
    Fig. 7. Average maximum EDA and minimum ESA versus hatching time of locust embryonic heart
    Scanning directionField of view /mmSize /pixel
    x (transverse)0720
    y (longitudinal)2160
    z (axial)3512
    Table 1. Scanning parameter setting of OCT
    Xiuli Wang, Ruoxuan Du, X.Steve Yao, Ya Su, Shengwei Cui, Peng Hao, Lijun Yang, Bingbing Duan. Automatic Detection and Quantitative Analysis of Insect Cardiac Function Parameters Using OCT[J]. Chinese Journal of Lasers, 2022, 49(20): 2007202
    Download Citation