Abstract
Heavy metals, one of the most toxic classes of pollutants, are resistant to degradation and harmful to the biological environment. The lakes that have developed on the Tibetan Plateau are ideal regions to investigate historic heavy metal pollution, particularly through the use of the reliable210Pb dating technique. Environmental magnetism has been successfully applied to estimate heavy metal pollution in different environmental systems due to its characteristics of simple processing steps, good sensitivity, and non-destructibility. However, it has not yet been applied to assess heavy metal pollution in lake sediments on the Tibetan Plateau. A series of environmental magnetic investigations of Qiangyong Co Lake sediments (southern Tibetan Plateau) was therefore conducted to explore the relationship between magnetic minerals and mercury (Hg) concentrations. The results showed that the magnetic mineral species in lake sediments remained stable, with similar levels of four different components from 1899 to 2011. However, the proportion of component 1 (C1, hematite) increased continuously with the corresponding decrease in the proportion of C2 (goethite), while the proportions of C3 and C4 (magnetite) did not change significantly. As a result, the bulk magnetic signals (e.g., SIRM and χlf) were unsuitable for the evaluation of the Hg concentration; however, the proportion of hematite had a strong positive correlation with the Hg concentration. It is possible that the Qiangyong Glacier (the main water supply for Qiangyong Co Lake) has experienced faster melting with global and local warming, and the Hg trapped in cryoconite and ice was released. Hematite, with a large specific surface area, has a strong capacity for absorbing Hg, and both materials are ultimately transported to Qiangyong Co Lake. The proportion of hematite in a sample is therefore a suitable semi-quantitative proxy that can be used to evaluate the Hg concentration in Qiangyong Co Lake sediments. This study confirmed that the variation of magnetic minerals can provide a new method to estimate the variation of Hg concentrations and to study the process of Hg deposition in lakes in the southern Tibetan Plateau on the basis of a detailed environmental magnetic analysis.1 Introduction
Due to its high altitude, the Tibetan Plateau (TP) is known as the world’s roof and is considered the third pole (Zheng and Yao, 2004). Sparse population on the TP is a consequence of its unique climatic ecological environment. There are relatively few agricultural and industrial activities on the TP; thus, the area is presumed to be largely unaffected by human activity and is considered a sensitive region for monitoring the atmospheric environment (Qiu, 2008). Even in Lhasa, the capital and most developed city of this region, the air quality has been good for many years (Yin et al., 2019). However, under the action of Westerlies and the Asian monsoon (Zhu et al., 2015; Yao et al., 2017; Guo et al., 2019), pollutants from outside the TP are transported into the region by dry and wet deposition (Li et al., 2007; Cong et al., 2010; Kang et al., 2019). For example, persistent organic pollutants (Zhang et al., 2003; Wang et al., 2016), heavy metals (Yang et al., 2010; Kang et al., 2016; Huang et al., 2019), polycyclic aromatic hydrocarbons (Xie et al., 2014), organic molecular tracers (Wan et al., 2017), and black carbon (Xu et al., 2009; Li et al., 2016; Wu et al., 2018; Chen et al., 2019) have been detected in aerosol particles, dust, snow, surface soil, ice cores, and lake sediments.
Due to their high levels of toxicity, long half-life, and refractory properties, heavy metal pollutants are considered to be one of the most harmful pollutants, and can pose a tremendous hazard to the ecological environment (Liu et al., 2016; Mamattursun et al., 2017). Previous studies have shown that some of the heavy metal pollution in the TP is due to traffic activity (Zhang et al., 2012) and fertilizer and pesticide use (Sun et al., 2016) inside the plateau, but the majority is from extraneous atmospheric particulate (dust and aerosol particles) inputs (Xiao et al., 2000; Zhang et al., 2003; Yang et al., 2010; Guo et al., 2016; Kang et al., 2016; Huang et al., 2019). The most commonly used experimental analysis method is the decomposition of samples by the Community Bureau of Reference (BCR) three-step sequential extraction procedure, followed by an inductively coupled plasma mass spectrometry (ICP-MS) analysis (Xiao et al., 2000; Zhang et al., 2012). The United States Environmental Protection Agency (US EPA) method 7473 is often adopted for the analysis of mercury (Hg) (Kang et al., 2016). Compared with this complicated method, environmental magnetism can characterize samples with simple processing steps and good sensitivity, and is non-destructive. It has been widely applied in the detection of heavy metal pollutants in dusts (Li et al., 2010), leaves or tree-rings (Zhang et al., 2007), soils (Zhang et al., 2009), and lake sediments (Liu et al., 2006). These studies suggest that rock magnetic parameters are strongly related to the heavy metal concentrations in environmental samples.
Based on 210Pb dating, continuous lake sediments from the TP can be used to investigate the heavy metal pollution history of lakes over the last hundred years (Yang et al., 2010; Wang et al., 2010). However, the relationship between heavy metals and rock magnetic parameters remains poorly understood. It is not clear whether the variation of magnetic minerals in the TP lake sediments is due to environmental changes or human activities since Industrial Revolution. Therefore, we conducted a detailed rock magnetic analysis of Qiangyong Co Lake sediments (southern TP) to investigate the variations in magnetic minerals. The environmental signals were further addressed by assessing the results alongside relevant environmental indexes and the total Hg concentration of the same sample.
2 Geological setting, sampling, and experiments
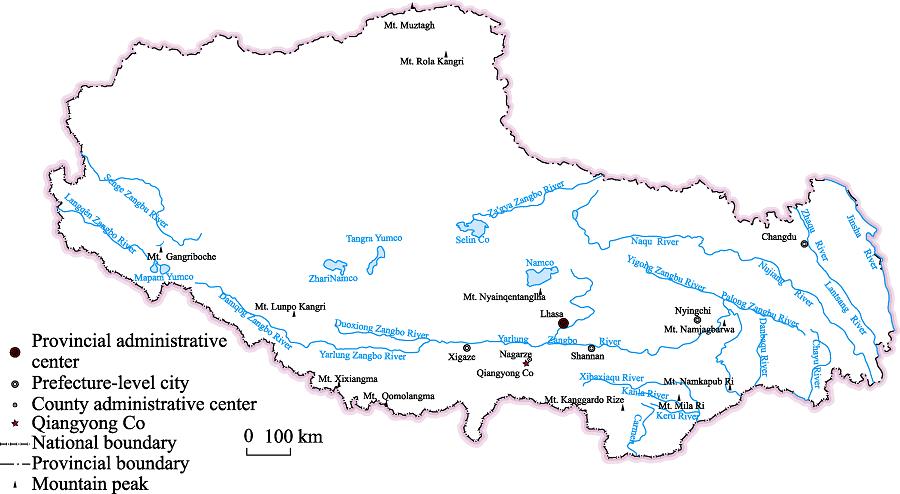
Qiangyong Co Lake (28.883°N, 90.217°E, ~4870 a.s.l), a proglacial lake of the southern TP, is mainly supplied by glacial meltwater from the Qiangyong Glacier in the summer. There are significant seasonal changes in the hydrologic conditions (Li et al., 2011). In spring and autumn, the lake system is in a relatively stable state, with little meltwater. In summer, a high meltwater discharge enters the lake, and ultimately the lake overflows, forming a river beneath the lake basin. Due to the low temperature in winter, the lake surface is frozen and water loss is mainly due to the sublimation of surface ice. According to meteorological data from Nagarze station (~15 km from Qiangyong Co Lake), the annual mean precipitation and annual average temperature is ~370 mm and ~2.9℃, respectively.

Figure 1.
Location of Qiangyong Co LakeA sediment core was drilled with a gravity corer (6 cm in diameter) in 2011 by a scientific expedition team from the Institute of Tibetan Plateau Research, Chinese Academy of Sciences (CAS). In the laboratory, the core was split, and one half was sampled with a stainless-steel knife at 5 mm intervals. Based on the 210Pb dating results, the variation of the Hg concentrations in the top sediment (0-9.5 cm) reflected the continuous increase in anthropogenic Hg emissions in South Asia from 1899 to 2011 (Kang et al., 2016). This study focused on the same period for which a systematic rock magnetic analysis was conducted. All experiments were performed in the Paleomagnetism and Geochronology Laboratory, Institute of Geology and Geophysics, CAS.
After freeze-drying and weighing, samples were placed into cubic plastic boxes (2.0× 2.0×2.0 cm3). First, low and high field susceptibility (χlf and χhf) were measured using an MFK1-Kappabridge magnetic susceptibility meter at frequencies of 976 and 15616 Hz, respectively. Then, anhysteretic remnant magnetization (ARM) was produced and acquired in a 100 mT peak alternating field under a bias field of 0.05 mT. Isothermal remnant magnetization (IRM) was acquired in direct current (DC) fields of 1 T (IRM1 T) and -300 mT (IRM-300 mT), with a 2G Enterprise pulse magnetization meter. The IRM1 T was referred to as saturation IRM (SIRM) in this study. Both ARM and IRM were measured with a 2G-760 magnetometer. Magnetic hysteresis loops, IRM curves, and the backfield demagnetization curves were measured in a maximum field of 1 T using a Model VSM 3900 Magnetometer. Coercivity (Bc), remnant magnetization (Mrs), saturation magnetization (Ms), and the remnant coercivity (Bcr) were acquired. The first three parameters were obtained after correction for paramagnetic contribution.
To identify the magnetic assemblage of Qiangyong Co Lake sediments, selected samples were analyzed in a series of experiments. (1) Temperature-dependence magnetic susceptibility (χ-T) curves were constructed based on measurements in an argon atmosphere using an MFK1-Kappabridge magnetic susceptibility meter from room temperature to 700℃, with an interval of 5℃. (2) Zero-field-cooling (ZFC) curves were constructed based on measurements with the MPMS XL-5 magnetic measurement system. After first being cooled to 20 K in a zero-field, the IRM of samples was acquired in a 2.5 T field, with measurements made as the temperature was increased from 20 to 300 K at a rate of 5 K/min in a zero-field. (3) First-order reversal curves (FORCs) were measured on a VSM 3900 magnetometer, and FORC diagrams were constructed from 108 FORCs, with a smoothing factor of 7. (4) Diffuse reflectance spectroscopy (DRS) measurements were made from 350 to 2500 nm using a Varian Cary 5000 spectrophotometer.
3 Results
3.1 Depth plot of variations in rock magnetic proxies
Based on the 210Pb chronology results and the variation of the Hg concentration (Kang et al., 2016), the sequence can be divided into three stages according to the variations of rock magnetic proxies: 1899-1951, 1951-1988, and 1988-2011 (Figure 2).
Figure 2.
Environmental magnetic parameters and mercury (Hg) concentrations of Qiangyong Co Lake (the Hg concentration and Qiangyong chronology are from <xref ref-type="bibr" rid="b25">Kang <italic>et al.</italic>, 2016</xref>)When evaluating the magnetic content χlf is one of the most widely used magnetic properties (Ao and Deng, 2007; Liu et al., 2012). The χlf of Qiangyong Co Lake ranges between 1.77×10⁻⁶-2.43×10⁻⁶ m3/kg, with a mean value of 2.05×10⁻⁶ m3/kg (Figure 2a). Prior to 1951, χlf displayed an increasing tendency. During the period 1951-1988, χlf changed slightly. After 1988, the χlf value fluctuated. The relative frequency-dependent susceptibility (χfd%, χfd% = (χlf-χhf)/χlf ×100%) is used to determine the concentration of fine superparamagnetic (SP) and stable single domain (SD) particles (Liu et al., 2012). Except the period 1943-1960, the variation in both χlf and χfd% displayed a similar tendency. For example, χlf increased suddenly in 1996 corresponding to the peak χfd% (Figure 2b). This implies the variation of χlf is related to the finer magnetic particle content.
ARM is mainly related to the SD particle content (Duan et al., 2012). The ARM of Qiangyong Co Lake was between 1.21×10⁻⁵-2.68×10⁻⁵ Am2/kg and displayed a pattern of variation that differed from that of χlf (and χfd%). There was a tendency for ARM to decrease from 1899 to 1951, followed by a slight increase until 1988, and then a decline during 1988-2011 (Figure 2c). Another concentration related magnetic parameter, SIRM, displayed a similar tendency to that of ARM aside from 1938 (Figure 2d).
The S-ratio (S0.3, S0.3 = IRM-300 mT/SIRM) is commonly used to determine the relative contribution of “soft” magnetic minerals (e.g., magnetite) compared to “hard” magnetic minerals (e.g., hematite and goethite) (Liu et al., 2012). The mean value of S0.3 was 0.751, which suggested that the dominant magnetic minerals are “soft”, e.g., magnetite. The overall changes of S0.3 were similar to those of SIRM (Figure 2e). The variation of the magnetic mineral content in Qiangyong Co Lake sediments was therefore dominated by soft magnetic minerals (e.g., magnetite).
The grain size dependent parameters ARM/SIRM, ARM/χlf and SIRM/χlf exhibited significant variations (Figures 2f-2h). Both ARM/χlf and SIRM/χlf tended to decrease from 1899 to 1951, implying the reduction of finer magnetic particles, but ARM/SIRM changed only slightly. During the period 1951-1988, all grain size dependent parameters varied slightly. Since 1988, both ARM/SIRM and SIRM/χlf had a tendency to increase, implying an increase in the amount of finer magnetic particles. The overall pattern of variation among the three parameters was similar, but not completely equivalent at the different stages. In comparison, SIRM/χlf was more suitable for representing the variation of magnetic grain size.
3.2 Magnetic assemblage
Day-plot diagrams of the Mrs/Ms and Bcr/Bcr values are widely used to visualize the domain state of the ferromagnetic minerals (Day et al., 1977; Dunlop, 2002a, 2002b). The Day-plots of Qiangyong Co Lake sediments are generally approaching to the SD region (Figure 3a). The 1899-1951 and 1988-2011 samples were mainly located in the top left corner close to the SD region, but the samples of 1951-1988 were generally plotted on the pseudo-single domain (PSD) region. It has been reported that the plotted values will shift to the top-right region when there is a certain amount of hematite (Dunlop, 2002a; Chen et al., 2009).
Figure 3.
Day-plot (a), magnetic hysteresis loops (b), isothermal remnant magnetization (IRM) acquisition curves (c), and backfield demagnetization curves (d) of Qiangyong Co LakeCharacterized by a wasp-waisted hysteresis, the loops displayed a similar behavior from 1899 to 2011 that did not close until 800 mT (Figure 3b), which indicated the coexistence of magnetic minerals with contrasting coercivities (Roberts et al., 1995). The IRM curves and backfield demagnetization curves are shown in Figures 3c-3d. Overall, the IRM curves rose sharply before 300 mT, then slowly increased to almost saturation at 600 mT, although the “hard” magnetic minerals were not completely saturated even at 1 T. This phenomenon was consistent with the hysteresis loop results. The Bcr value and the behavior of the IRM was also correlated (Figures 2c-2d). Among the three periods investigated, 1899-1951 had the smallest mean Bcr value (103.09 mT) and the most rapid rise in the IRM curves of the samples occurred before 300 mT. During 1988-2011, the slowest rise in the IRM curves for the samples with the largest mean value of Bcr (132.26 mT) occurred before 300 mT. During 1951-1988, the samples had a median Bcr value that corresponded to an intermediate rate of increase in the IRM curves.
A FORC diagram is very useful for identifying the domain state of magnetic materials and the interaction field among magnetic particles (Liu et al., 2012). Characteristic samples of the three stages displayed a similar shape (Figures 4b-4d), with a distinct component around ~20 mT and a large spread along the Hc axis, which suggested that the sample had a complex magnetic mineral composition. To determine the magnetic composition of samples, IRM curves were unmixed using the method adopted by Heslop et al. (2002) and Egli (2003). All samples consisted of four components: Component 1 (C1, B1/2: ~112 mT), Component 2 (C2, B1/2: 186.2-330 mT), Component 3 (C3, B1/2: 36.3 mT), and Component 4 (C4, B1/2: 6.3 mT) (Figures 4e-4j). C3 and C4 corresponded to low coercivity (“soft”) minerals (e.g., magnetite and maghemite). Both contributed to the closed concentric contours about a central peak of ~20 mT for Hc. C1 and C2 corresponded to median and high coercivity minerals, respectively (e.g., hematite and goethite), which are the magnetic carriers for the broad spread of Hc.
Figure 4.
Saturation isothermal remnant magnetization (SIRM) (a), Unmixing of IRM acquisition curves (b-g), First-order reversal curves (FORCs) (h-j) and χ-T (k-m) of typical samplesThe characters of the χ-T curves for selected samples were similar (Figures 4k-4m). The heating curves of χ-T exhibited a weak increase between ~250 and 300℃, which was probably related to the neoformation of maghemite (Deng et al., 2002). Up to ~430℃, χ increased rapidly and then displayed a notable peak around ~520℃. This phenomenon resembled the χ-T curves for the Quaternary loess (Deng et al., 2002). There are two possible mechanisms for the phenomenon: the Hopkinson effect of SD particles and the neoformation of magnetite. During the heating cycle, χ-T exhibited a marked decrease at ~585℃, but with a tail until 700℃, which indicated the presence of hematite. The cooling and heating curves were reversible between ~510 and ~700℃, which indicated the presence of SD particles, with the Hopkinson effect. The χ values after the cooling process were higher than those of the samples before the heating process, which indicated the generation of some strongly magnetic minerals (e.g., magnetite) during the heating process.
No Verwey transition was found in the raw data of the ZFC curves, but it was found in the first-order derivative data of the ZFC curves (Figure 5a), implying there was some magnetite in the SP particles or some undetectable multi-domain magnetite (Verwey, 1939; Muxworthy and McClelland, 2000; Kosterov, 2003). In the second-derivative curves of the DRS data, hematite and goethite were conformed to have notable wave troughs at ~535 and ~425 nm, respectively (Torrent and Barrón, 2008; Jiang et al., 2016). The presence of goethite and hematite was therefore indicated from the second-derivative curves of DRS data of selected samples (Figure 5b).
Figure 5.
Zero-field-cooling (ZFC) curves (a, the solid and dashed lines represent the origin data and first derivative data of the ZRC curves, respectively) and the second derivative curves of diffuse reflectance spectroscopy (DRS) (b) for selected samples from Qiangyong Co LakeCombined with the results of all experiments, the magnetic minerals of Qiangyong Co Lake sediments are contributed by four components from 1899 to 2011, implying the sources of magnetic minerals for the Qiangyong Lake sediments have not changed since 1899. From the FORC diagrams, χ-T, ZFC curves, and DRS data, it was possible to identify C3 and C4 as magnetite, C2 as goethite, and C1 as finer hematite based on the Day-plot analysis. This kind of hematite has also been found in paleosols (Hu et al., 2013).
4 Discussion
Both χlf and SIRM can be used as proxy indicators for heavy metals. For example, χlf was found to correlate strongly with the Hg concentration in samples from Baiyangdian Lake, northern China (Guo et al., 2015). For Qiangyong Co Lake sediment samples, the relationship between SIRM (or χlf) and the Hg concentration is complicated (Figures 2a, 2d, and 2i). Before 1951, there was a positive correlation between χlf and the Hg concentration (Figure 6a), but a negative correlation between SIRM (or SIRM/χlf) and the Hg concentration (Figures 6b-6c). However, after 1951, there was no obvious relationship between χlf and the Hg concentration (Figure 6a), but there was a positive correlation between SIRM (or SIRM/χlf) and the Hg concentration (Figures 6b-6c). This phenomenon was likely due to the different controlling factors. There were some SP particles which contributed to the high χlf, but did not contribute to the SIRM. The magnetic minerals of Qiangyong Co Lake consisted of four different components. They therefore differed from the Baiyangdian Lake sediment, which were found to be dominated by ferrimagnetic minerals generated by industrial activities (Guo et al., 2015). Additionally, the proportion of the four components varied to different extents from 1899 to 2011, with a few exceptions (the years 1922 and 1971). The percentage content of C1 continuously increased, the percentage content of C2 continually decreased, the percentage content of C3 fluctuated between 11% and 16%, and the percentage content of C4 remained relatively constant at ~6%. The changing proportions of the different components would have different effects on SIRM and χlf. Therefore, the variation of the Hg concentration cannot be simply expressed by χlf or SIRM for Qiangyong Co Lake sediments.
Figure 6.
Correlations between the variations of magnetic components and mercury (Hg) concentration in Qiangyong Co Lake and environmental indexes (annual average precipitation and temperature) of Nagarze stationIn Qiangyong Co Lake, the proportions of C3 and C4 changed slightly, which was related to the increased Hg content. However, there was a strong positive (or negative) relationship between the proportion of C1 (or C2) and the Hg concentration (Figures 6d-6e, 7a-7b and 7h), with the exception of 1922 and 1971. A closer relationship was found between the ratio of C1 to C2 (C1/C2) and the Hg concentration (Figure 6f). Previous studies have shown that there are two possible mechanisms that explain the positive correlation between magnetic parameters and heavy metals. One is that both the magnetic minerals and heavy metal minerals are generated together by industrial combustion or heating processes (Hanesch et al., 2003; Hu et al., 2008). The other is that magnetic minerals with a large surface area can absorb heavy metals (e.g., Pb and Hg), and they go through the same process of transport and precipitation (Gautam et al., 2005; Spiteri et al., 2005). Magnetic minerals (magnetite, hematite, and pyrrhotite) produced by industrial processes are larger than naturally occurring magnetic minerals (e.g., Zhang et al., 2009). In Qiangyong Co Lake sediments, magnetic minerals were primarily composed of finer particles as revealed by the Day plot (Figure 3a), which was not consistent with the reported industrially-generated magnetic minerals. The transport of magnetic minerals by dust and aerosol follows a clear distance-decay law, with smaller quantities transported further distances. Qiangyong Co Lake is located in the southern TP, a developing area of industrialization far human pollution sources. The magnetic mineral species have clearly not changed since 1899. Thus, industrial pollution can therefore be excluded as the major source of the magnetic minerals of the Qiangyong Co Lake sediments.
The pathways by which Hg and magnetic minerals entered Qiangyong Co Lake were similar. Hg enters the lake system by dry or wet deposition, while magnetic minerals are transported to the lake system by dust, rainfall, and runoff. The most likely mechanism for the strong positive correlation between the Hg content and the proportion of C1 is that hematite, with a large surface area, can absorb Hg and both will then settle into Qiangyong Co Lake via the same transport process. In contrast, C2 avoids Hg adsorption and its proportional content declined with the increase in C1 content since 1899. This could explain the strong negative correlation between Hg and C2, and why there was significant stronger linear relationship between the Hg concentration and C1/C2.
The main water sources for Qiangyong Co Lake are glaciers and snow meltwater rivers on Qiangyong Glacier. Glacier and snow runoff are therefore the main carriers of magnetic minerals into Qiangyong Co Lake. Of the four components, C1 (hematite) accounted for the largest percentage since 1899. Therefore, C1 should correspond to the magnetic minerals transported by glacier and snow runoff. The annual average temperature of both Nagarze station and the whole TP displayed a warming tendency from 1951 to 2011 (Duan et al., 2011). The Northern Hemisphere temperature anomaly has continually increased since 1899. Local and global warming has resulted in the rapid melting of glaciers and large amounts of C1 are carried by the increased meltwater volume. This was verified by the strong correspondence between the magnetic components and annual average temperature of Nagarze station from 1951 to 2011 (Figures 6j-6l and 7f-7h). Glaciers are a temporary reservoir of Hg (Zhang et al., 2012), which is released again with glacier or snow melt. Cong et al. (2018) found that magnetic minerals (hematite and goethite) are important constituents of cryoconite, which is a mixture of incoherent impurities and ice that is present on the surface of glaciers in summer. Through the enrichment and release processes, Hg is absorbed by hematite and ultimately transported to Qiangyong Co Lake.
Unstable local atmospheric circulations can induce dust storms when the temperature increases (Hu and Mistuta, 1997). Duan et al. (2011) found that the occurrence of dust storms peaked around the 1980s. This pattern differed from the variations of C1 and the Hg concentration. Dry deposition related to dust activities was not the main source of C1 and Hg. It may also be possible that Hg and magnetic minerals enter Qiangyong Co Lake by precipitation. There has been a trend for Hg levels in precipitation to increase in connection with the recent economic development in South Asia in the southern TP (Huang et al., 2015). The annual average precipitation of Nagarze station has fluctuated frequently since 1951, with no direct relationship with C1 (Figures 6g-6i, 7e and 7h). We can therefore rule out the possibility that the hematite in Qiangyong Co Lake originated mainly from rainfall, with few insoluble particles present in precipitation. However, some proportion of the Hg will originate from rainfall. This explains why the relationship between the Hg concentration and C1 was not strongly correlated.
Figure 7.
The variations of different magnetic components of Qiangyong Co Lake (a-d), annual precipitation (e), average temperature from Nagarze station (f), temperature anomaly of the Tibetan Plateau and the Northern Hemisphere (g), and Hg concentration (h) (the Hg concentration and Qiangyong chronology are from <xref ref-type="bibr" rid="b25">Kang <italic>et al.</italic>, 2016</xref>; the temperature anomaly of the Tibetan Plateau and the Northern Hemisphere)5 Conclusion
The magnetic mineral species in Qiangyong Co Lake sediments did not change from 1899 to 2011, and were composed of four components: C1 (hematite), C2 (goethite), and C3 and C4 (magnetite). The percentage content of each component varied, with the proportion of C3 and C4 changing slightly, the proportion of C1 increasing, and the proportion of C2 decreasing. Therefore, SIRM and χlf were unsuitable for evaluating the Hg concentration. There was a strong positive correlation between the proportion of C1 and the Hg concentration. The proportion of hematite can therefore be used as a semi-quantitative proxy to evaluate the Hg content for Qiangyong Co Lake sediments. The most likely mechanism is that a large amount of Hg that had deposited and was sealed on the Qiangyong Glacier was released again with the rapid melting of the glacier as the climate has warmed since 1899. In this process, hematite with a large surface area absorbed Hg, which was then transported to Qiangyong Co Lake by glacier meltwater.
This study confirmed that magnetic parameters (i.e., the proportion of hematite) can be used to evaluate the variation of heavy metal (Hg) concentrations in the TP lakes. Such evaluations should be conducted with detailed and careful environmental magnetic experiments. Future studies will be conducted on the other proglacial lakes of the southern TP, and then extended to the whole TP to confirm our findings. A determination of the hematite and Hg transport processes is vital, and therefore cryoconite and Qiangyong glacier meltwater, surface soils around Qiangyong Co Lake and runoff area, local rainfall, and dust will be sampled to conduct magnetic and Hg analyses.