
Tian-Jun Liao, Bi-Hong Lin, Yu-Hui Wang. Performance characteristics of a novel high-efficientgraphene thermionic power device [J]. Acta Physica Sinica, 2019, 68(18): 187901-1
- Acta Physica Sinica
- Vol. 68, Issue 18, 187901-1 (2019)
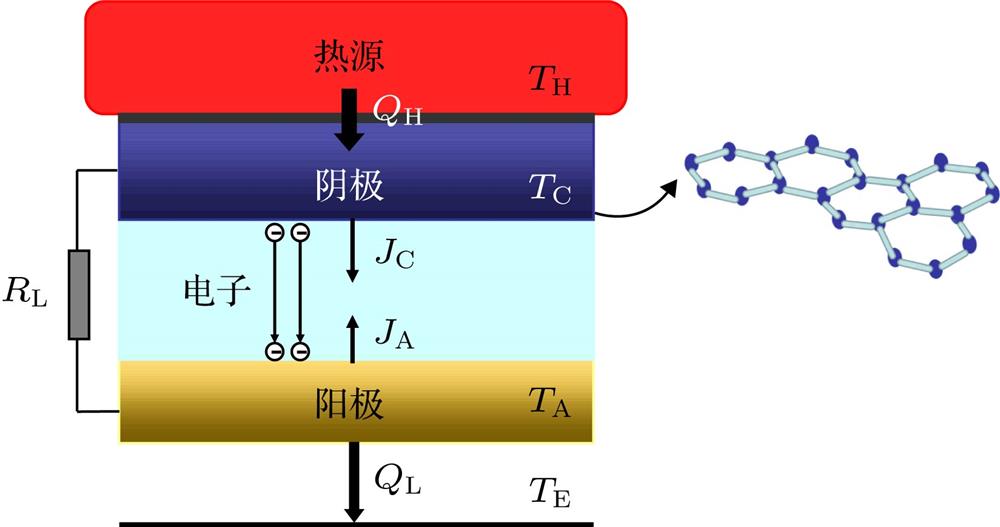
Fig. 1. Schematic diagram of a graphene-based TPD.石墨烯TPD示意图
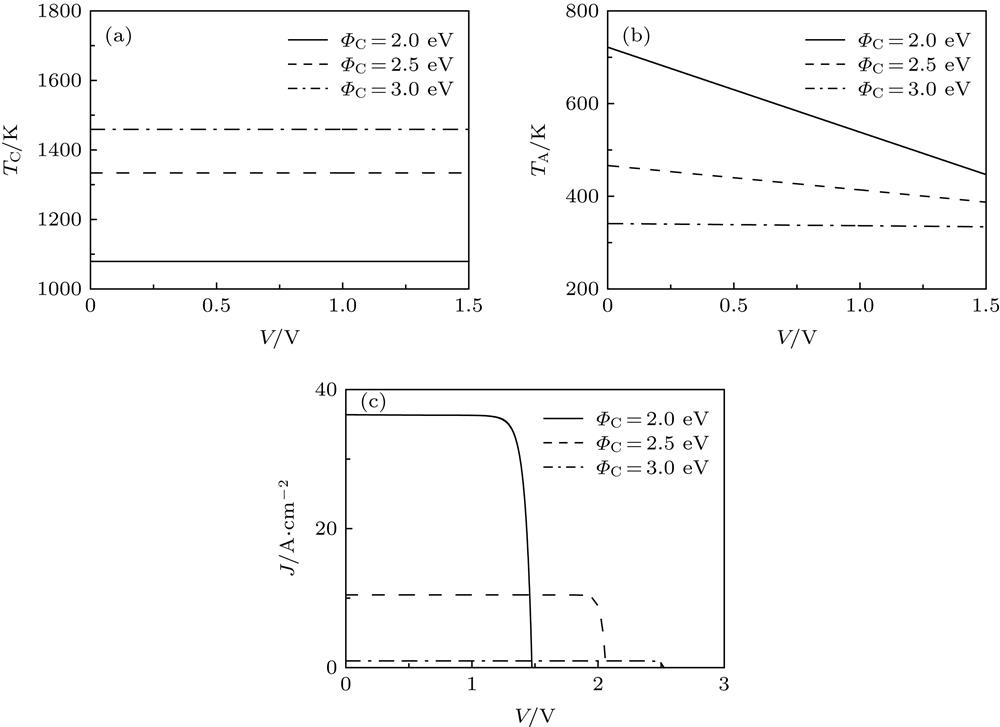
Fig. 2. (a) Curves of the cathode temperature, and (b) the anode temperature varying with the output voltage, and (c) the volt-ampere characteristic for given values of
, where
,
,
,
, and
.
给定不同
时, (a)阴极温度和(b)阳极温度随输出电压变化曲线及(c)伏安特性曲线, 其中
,
,
,
和
Fig. 3. Three-dimensional graphs of (a) the power density and (b) the efficiency varying with the output voltage and the work function of the cathode.(a) TPD的功率密度和(b)效率随输出电压和阴极板功函数变化的三维图
Fig. 4. Curves of (a) the optimal power density and work function, (b) the optimal efficiency and work function varying with the voltage, and (c) the performance characteristic of TPD.(a) TPD的优化功率密度和阴极功函数, (b)优化效率和阴极功函数随电压变化的曲线以及(c)性能特征曲线
Fig. 5. Curves of (a)
and
, (b)
and
, and (c)
and
as a function of
.
(a)
和
, (b)
和
, (c)
和
随
的变化
Fig. 6. Curves of
and
as a function of
, where
.
和
随
变化的曲线, 其中
|
Table 1. Values of key parameters at the optimum performances for the present work and the Ref. [23].

Set citation alerts for the article
Please enter your email address
© Copyright 2018-2021 | Chinese Laser Press. All Rights Reserved 沪ICP备15018463号-20