• Acta Geographica Sinica
  • Vol. 75, Issue 8, 1757 (2020)
Shimin FANG* and Yan HUANG
Author Affiliations
  • Business School, Xiangtan University, Xiangtan 411105, Hunan, China
  • show less
    DOI: 10.11821/dlxb202008014 Cite this Article
    Shimin FANG, Yan HUANG. Spatiotemporal evolutions and coordination of tourism efficiency and scale in the Yangtze River Economic Belt[J]. Acta Geographica Sinica, 2020, 75(8): 1757 Copy Citation Text show less
    The administrative map of the Yangtze River Economic Belt
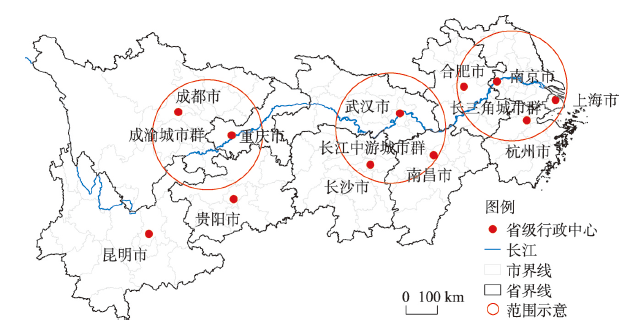
    Fig. 1. The administrative map of the Yangtze River Economic Belt
    Average performance of tourism static efficiency and tourism scale in the Yangtze River Economic Belt from 2001 to 2018
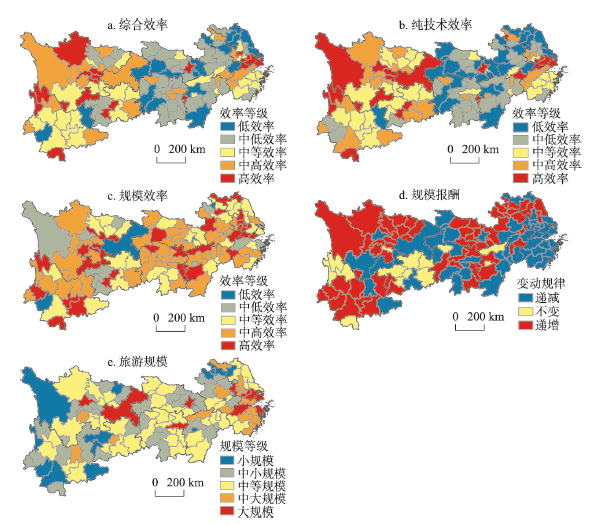
    Fig. 2. Average performance of tourism static efficiency and tourism scale in the Yangtze River Economic Belt from 2001 to 2018
    Spatial distribution of LISA time paths for tourism efficiency and tourism scale in the Yangtze River Economic Belt
    Fig. 3. Spatial distribution of LISA time paths for tourism efficiency and tourism scale in the Yangtze River Economic Belt
    Spatial distribution of the coupling degree and coordination coupling degree of tourism efficiency and tourism scale
    Fig. 4. Spatial distribution of the coupling degree and coordination coupling degree of tourism efficiency and tourism scale
    类型时空跃迁形式符号表达
    I型自身跃迁—邻域稳定HHt→LHt+1、LHt→HHt+1、HLt→LLt+1、LLt→HLt+1
    II型自身稳定—邻域跃迁HHt→HLt+1、LHt→LLt+1、HLt→HHt+1、LLt→LHt+1
    III型自身跃迁—邻域跃迁HHt→LLt+1、LLt→HHt+1、LHt→HLt+1、HLt→LHt+1
    IV型自身稳定—邻域稳定HHt→HHt+1、HLt→HLt+1、LLt→LLt+1、LHt→LHt+1
    Table 1. Type of space-time transition
    时段EFFCHTECHCHPECHSECHTFPCH
    2001—2002年1.3300.8541.2611.0541.121
    2002—2003年1.1260.9681.0721.0501.038
    2003—2004年1.1281.0901.0961.0291.175
    2004—2005年0.9041.3260.9600.9421.131
    2005—2006年1.2031.0431.1431.0531.217
    2006—2007年1.0041.0841.0380.9671.085
    2007—2008年1.0901.0171.0641.0241.091
    2008—2009年1.0021.1860.9821.0191.179
    2009—2010年0.9551.2630.9521.0031.196
    2010—2011年1.0721.1811.0930.9811.253
    2011—2012年1.0081.1750.9951.0131.173
    2012—2013年1.0591.1011.0600.9991.157
    2013—2014年1.0151.1401.0111.0031.153
    2014—2015年0.9801.2581.0040.9761.227
    2015—2016年1.0501.1941.0520.9991.224
    2016—2017年0.9551.3290.9720.9831.255
    2017—2018年0.8781.4960.9240.9501.304
    均值1.0451.1591.0401.0031.175
    Table 2. The Malmquist production index and its decomposition of tourism efficiency in the Yangtze River Economic Belt from 2001 to 2018
    旅游效率旅游规模
    HHt+1HLt+1LHt+1LLt+1HHt+1HLt+1LHt+1LLt+1
    HHtⅣ(10, 0.079)Ⅱ(6, 0.048)Ⅰ(3, 0.024)Ⅲ(8, 0.063)Ⅳ(5, 0.040)Ⅱ(0, 0.000)Ⅰ(0, 0.000)Ⅲ(0, 0.000)
    HLtⅡ(8, 0.063)Ⅳ(10, 0.079)Ⅲ(7, 0.056)Ⅰ(7, 0.056)Ⅱ(3, 0.024)Ⅳ(16, 0.127)Ⅲ(0, 0.000)Ⅰ(0, 0.000)
    LHtⅠ(8, 0.063)Ⅲ(7, 0.056)Ⅳ(6, 0.048)Ⅱ(2, 0.016)Ⅰ(0, 0.000)Ⅲ(0, 0.000)Ⅳ(6, 0.048)Ⅱ(0, 0.000)
    LLtⅢ(5, 0.040)Ⅰ(8, 0.063)Ⅱ(4, 0.032)Ⅳ(27, 0.214)Ⅲ(8, 0.063)Ⅰ(10, 0.079)Ⅱ(6, 0.048)Ⅳ(72, 0.057)
    Table 3. Transition probability matrix of Local Moran's I
    Shimin FANG, Yan HUANG. Spatiotemporal evolutions and coordination of tourism efficiency and scale in the Yangtze River Economic Belt[J]. Acta Geographica Sinica, 2020, 75(8): 1757
    Download Citation