• Photonics Research
  • Vol. 10, Issue 2, 401 (2022)
Ang Gao1、2、†, Chen Yang1、†, Likun Chen2、†, Ru Zhang1, Qiang Luo1, Wei Wang2, Qitao Cao2, Zhenzhong Hao1, Fang Bo1、3、*, Guoquan Zhang1、4、*, and Jingjun Xu1、5、*
Author Affiliations
  • 1MOE Key Laboratory of Weak-Light Nonlinear Photonics, TEDA Institute of Applied Physics and School of Physics, Nankai University, Tianjin 300457, China
  • 2State Key Laboratory for Artificial Microstructure and Mesoscopic Physics, School of Physics, Peking University, Beijing 100871, China
  • 3e-mail: bofang@nankai.edu.cn
  • 4e-mail: zhanggq@nankai.edu.cn
  • 5e-mail: jjxu@nankai.edu.cn
  • show less
    DOI: 10.1364/PRJ.447488 Cite this Article Set citation alerts
    Ang Gao, Chen Yang, Likun Chen, Ru Zhang, Qiang Luo, Wei Wang, Qitao Cao, Zhenzhong Hao, Fang Bo, Guoquan Zhang, Jingjun Xu. Directional emission in X-cut lithium niobate microresonators without chaos dynamics[J]. Photonics Research, 2022, 10(2): 401 Copy Citation Text show less
    (a) Illustration of ray dynamics in X-cut uniaxial disks. Blue, black, and orange arrows denote the wave vector, Poynting vector, and crystal axis, respectively. (b) PSOS and emerging Husimi function of modes, in which the field distribution was acquired from the simulation with size parameter kR=40. The defused areas colored in blue and orange represent the electric-field distribution of modes with q=3 and q=11, respectively. Insets: real-space profile of the corresponding modes. (c) A close-up of the reflection point in (a). The incident beam and reflected beam with a time interval Δt are shown. The conserved quantity is depicted in the Huygens’s wave propagation diagram, where the red line denotes cL/(noneΔt). (d) Phase space spanned by position φ and the conserved quantity L.
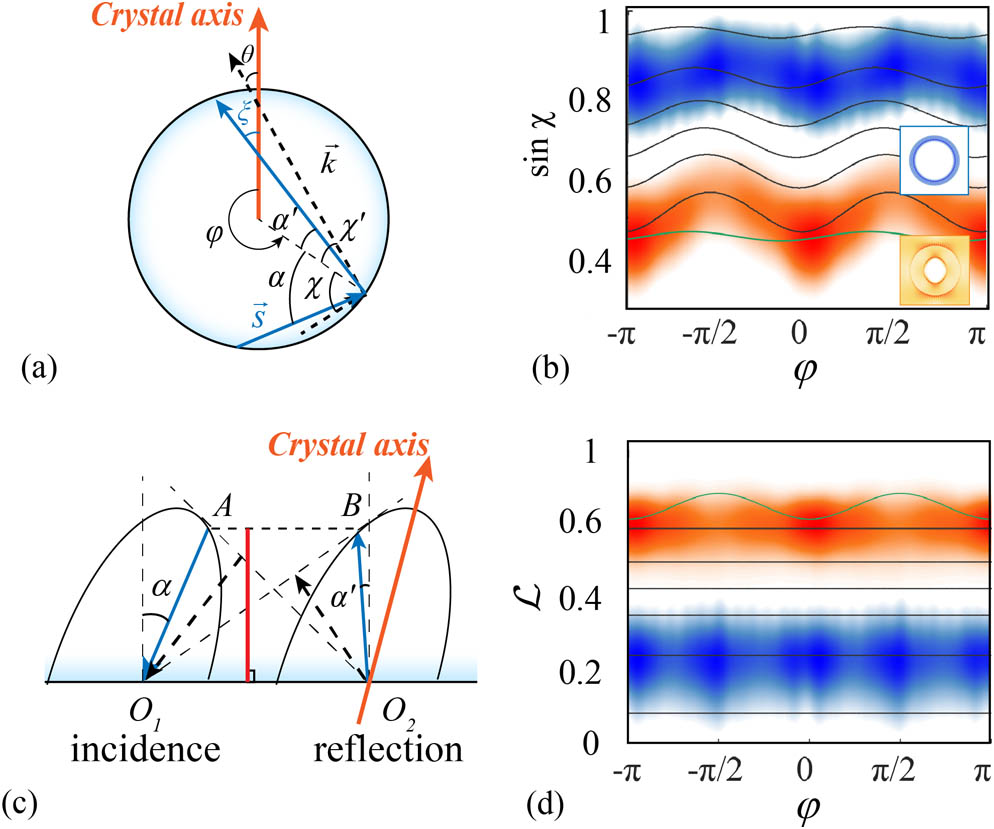
    Fig. 1. (a) Illustration of ray dynamics in X-cut uniaxial disks. Blue, black, and orange arrows denote the wave vector, Poynting vector, and crystal axis, respectively. (b) PSOS and emerging Husimi function of modes, in which the field distribution was acquired from the simulation with size parameter kR=40. The defused areas colored in blue and orange represent the electric-field distribution of modes with q=3 and q=11, respectively. Insets: real-space profile of the corresponding modes. (c) A close-up of the reflection point in (a). The incident beam and reflected beam with a time interval Δt are shown. The conserved quantity is depicted in the Huygens’s wave propagation diagram, where the red line denotes cL/(noneΔt). (d) Phase space spanned by position φ and the conserved quantity L.
    Emission directionality regulated by (a) the ratio between ne/no and (b) the radius of the microcavity, where the far-field angle is defined as γ. (a) Emission property of modes in X-cut LN microdisks with kR=40.5 at 400 nm, 532 nm, 633 nm, 780 nm, 980 nm, 1064 nm, 1310 nm, 1550 nm, 2100 nm, and 4000 nm, respectively. (b) Emission property in the band of 780 nm and 1550 nm. The far-field angle varies slowly when R≥20 μm. Right: a selection of four far-field emission intensity and near-field patterns related to the data points in the left panel, denoted by (i)–(iv). Black, red, and blue curves represent the CW, CCW, and standing wave modes.
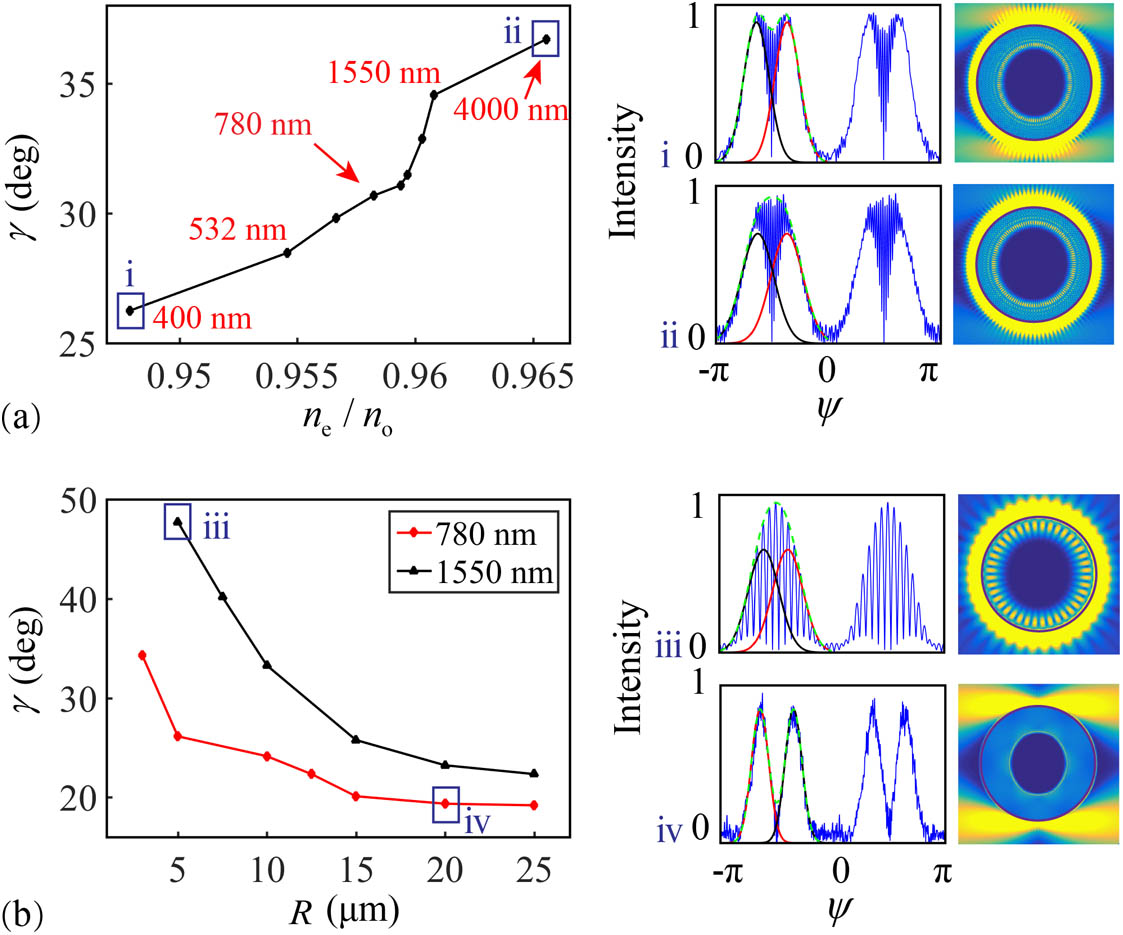
    Fig. 2. Emission directionality regulated by (a) the ratio between ne/no and (b) the radius of the microcavity, where the far-field angle is defined as γ. (a) Emission property of modes in X-cut LN microdisks with kR=40.5 at 400 nm, 532 nm, 633 nm, 780 nm, 980 nm, 1064 nm, 1310 nm, 1550 nm, 2100 nm, and 4000 nm, respectively. (b) Emission property in the band of 780 nm and 1550 nm. The far-field angle varies slowly when R20  μm. Right: a selection of four far-field emission intensity and near-field patterns related to the data points in the left panel, denoted by (i)–(iv). Black, red, and blue curves represent the CW, CCW, and standing wave modes.
    Experimental setup and characterization of the X-cut LNOI microdisks. (a) Setup to study the pattern of high-order modes excited by second-harmonic generation. VOA, variable optical attenuator; PC, polarization controller; PD, photodetector; OSC, oscilloscope. (b) Scanning electron microscopy images of the LN microresonator for geometric parameter measurements of LN disks. (c) A close-up of the light collection system for both near-field and far-field measurement. (d) Q factor measurement of a typical whispering gallery mode of the resonator.
    Fig. 3. Experimental setup and characterization of the X-cut LNOI microdisks. (a) Setup to study the pattern of high-order modes excited by second-harmonic generation. VOA, variable optical attenuator; PC, polarization controller; PD, photodetector; OSC, oscilloscope. (b) Scanning electron microscopy images of the LN microresonator for geometric parameter measurements of LN disks. (c) A close-up of the light collection system for both near-field and far-field measurement. (d) Q factor measurement of a typical whispering gallery mode of the resonator.
    (a) Transmission spectrum from 1535 nm to 1570 nm with the mode characterization in simulation. Insets: field patterns of the pump and SHG mode, respectively. Simulations are done by setting the refractive index of material as the average one of TE modes over regions. (b) Near-field pattern from the top viewer. Inset: far-field intensity from the side viewer. Red and green curves denote the experimental and simulation result, respectively. (c) Near-field intensity at the periphery of the resonator. The demonstrated data are extracted from the R=20.1 μm circle near the disk boundary shown in (b).
    Fig. 4. (a) Transmission spectrum from 1535 nm to 1570 nm with the mode characterization in simulation. Insets: field patterns of the pump and SHG mode, respectively. Simulations are done by setting the refractive index of material as the average one of TE modes over regions. (b) Near-field pattern from the top viewer. Inset: far-field intensity from the side viewer. Red and green curves denote the experimental and simulation result, respectively. (c) Near-field intensity at the periphery of the resonator. The demonstrated data are extracted from the R=20.1  μm circle near the disk boundary shown in (b).
    Ang Gao, Chen Yang, Likun Chen, Ru Zhang, Qiang Luo, Wei Wang, Qitao Cao, Zhenzhong Hao, Fang Bo, Guoquan Zhang, Jingjun Xu. Directional emission in X-cut lithium niobate microresonators without chaos dynamics[J]. Photonics Research, 2022, 10(2): 401
    Download Citation