
Liye Li, Yifan Ouyang, Lijun Ma, Hongshun Sun, Yusa Chen, Meizhang Wu, Zhimei Qi, Wengang Wu, "Reflection-type surface lattice resonances in all-metal metasurfaces for refractive index sensing," Photonics Res. 11, 2210 (2023)
- Photonics Research
- Vol. 11, Issue 12, 2210 (2023)
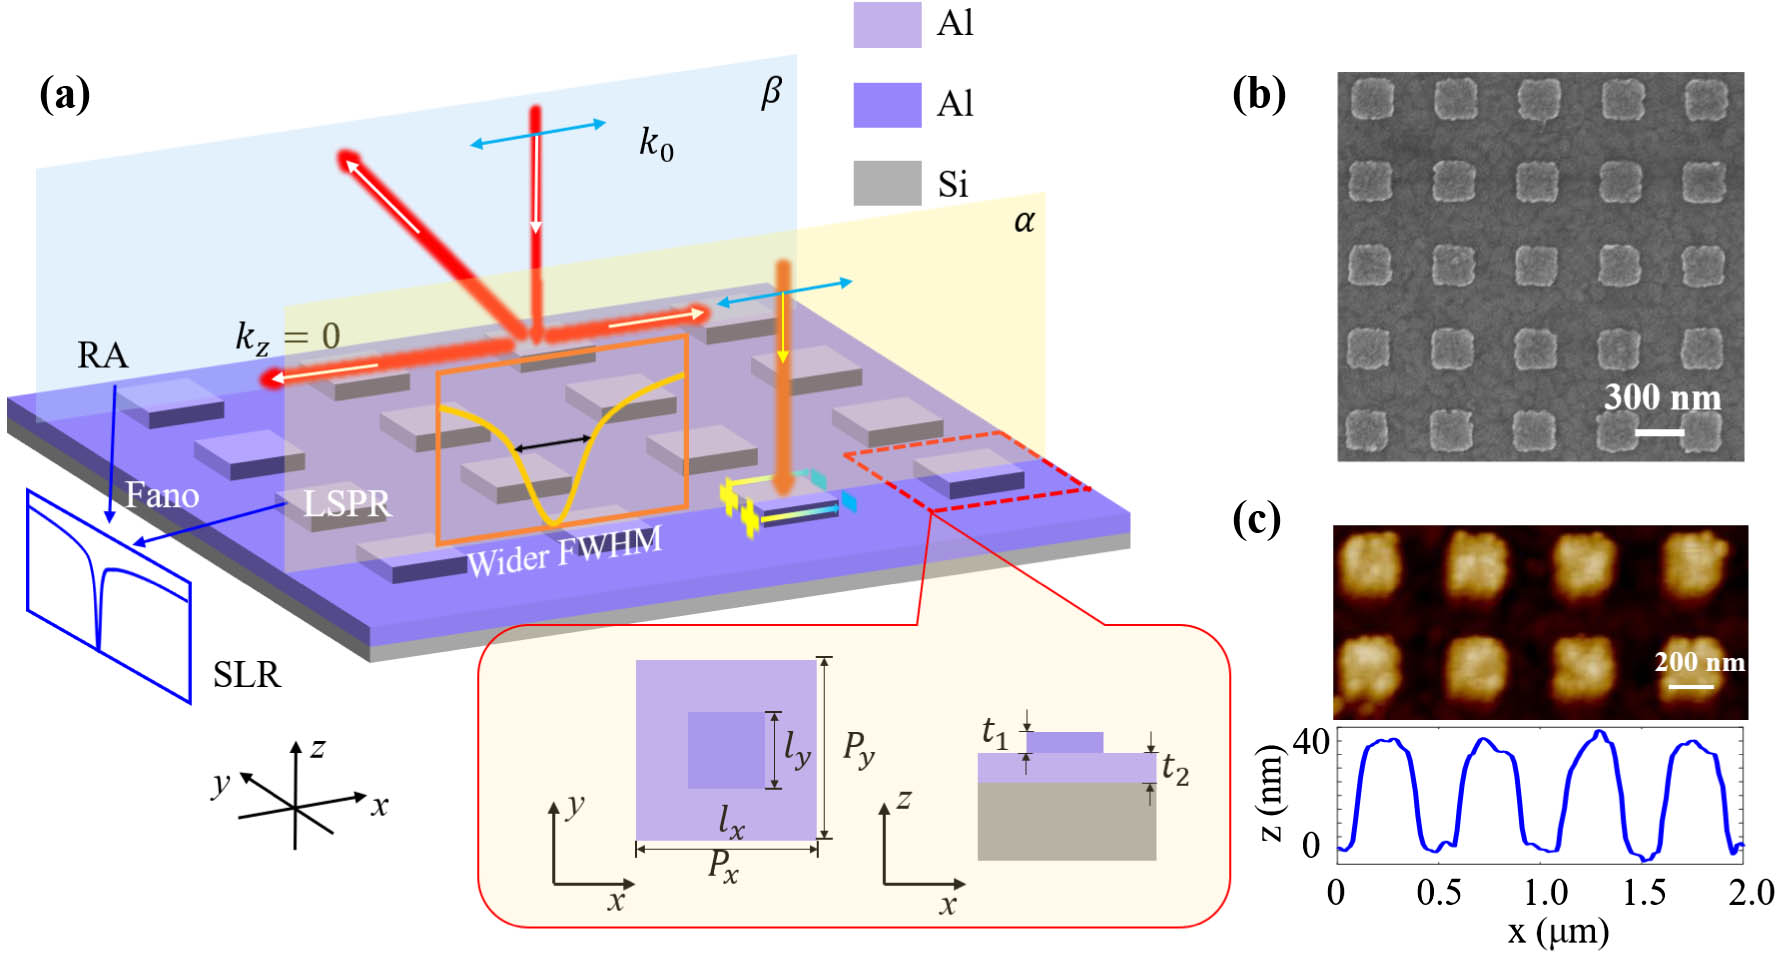
Fig. 1. Schematics and experimental characterization of the proposed all-metal metasurface. (a) Schematic illustration of the all-metal metasurface and the coupling between the LSPR and the RA. The structural parameters are as follows: P x = P y = 500 nm l x = l y = 250 nm t 1 = 40 nm t 2 = 150 nm

Fig. 2. Experimental and simulated results of the designed metasurface. (a) Measured and (b) numerical simulation reflection spectra of metasurfaces with different meta-atom widths of 200 nm, 250 nm, and 300 nm. Electric field E z x – y x – z
Fig. 3. RI sensing results of numerical simulation and measurement. (a) Variation of simulated SLR spectra with RI environments. (b) SLR dip positions in the spectra and corresponding calculated RI sensing sensitivity. (c) Measured reflection-type SLR spectra under air (n = 1.0000 n = 1.3333 n = 1.3614 n = 1.3772 Q -factors. (e) Numerical simulation transmission-type SLR spectra under different RI environments. (f) SLR dip positions and RI sensitivities. The orange line is composed of four line segments with different gradients, with a low linearity. The inset is the designed transmission metasurface model and the length unit is in nanometers.
Fig. 4. Spectra and sensitivities of other metasurfaces. (a) Measured reflection-type SLR spectra in different RI environments and (b) RI sensitivity of the metasurface with P x = 600 nm l x = 400 nm P x = 700 nm l x = 450 nm
Fig. 5. Experimental results from angular multiplexing with different polarization modes. (a) Measured reflection spectra of the TM beam in the case of different incident angles from 10° to 50° at a 10° interval. (b) Measured reflection spectra of the TE beam with different incident angles from 5° to 25° at a 5° interval. Measured SLR spectra under the different RI conditions of the (c) TM beam and (d) TE beam ( θ i = 20 ° )
Fig. 6. Experimental results from a rectangular array. (a) SEM image of the all-metal metasurface with the rectangular array (P x = 500 nm P y = 600 nm l x = 250 nm l y = 400 nm x y
Fig. 7. Measured and simulated spectra and SEM images of metasurfaces with the (a) hexagonal meta-atom, (b) nanohole meta-atom, (c) hexagonal array, and (d) honeycomb array. The above SLR spectra are all excited by x
Fig. 8. (a) Theoretical calculation wavelengths of the k SPP k RA
Fig. 9. (a) Simulated reflection spectra and (b) SLR dip positions of the metasurface with P x = 600 nm P x = 700 nm
Fig. 10. (a), (b) Simulated reflection spectra and SLR dip positions of the Au metasurface under different RI environments. Inset image is the structure diagram with geometric parameters (P x = P y = 650 nm l x = l y = 300 nm t 1 = 40 nm P x = P y = 500 nm l x = l y = 200 nm t 1 = 40 nm
Fig. 11. Schematic diagrams of the (a) TM mode incidence and (b) TE mode incidence.
Fig. 12. Normalized electric field E z x y
Fig. 13. (a) SEM image of the proposed metasurface with the rectangular array (P x = 500 nm P y = 700 nm l x = 250 nm l y = 500 nm h = 50 nm x y
Fig. 14. Schematic diagrams of the (a) hexagonal array and (b) honeycomb array.


Set citation alerts for the article
Please enter your email address

© Copyright 2018-2021 | Chinese Laser Press. All Rights Reserved 沪ICP备15018463号-20