• Chinese Optics Letters
  • Vol. 14, Issue 7, 072501 (2016)
Xianghao Zeng, Yong Wang, Yonghua Lu, and Pei Wang*
Author Affiliations
  • Department of Optics and Optical Engineering, Anhui Key Laboratory of Optoelectronic Science and Technology, University of Science and Technology of China, Hefei 230026, China
  • show less
    DOI: 10.3788/COL201614.072501 Cite this Article Set citation alerts
    Xianghao Zeng, Yong Wang, Yonghua Lu, Pei Wang. Nonlocal response of electric and magnetic modes in a silver cuboid dimer[J]. Chinese Optics Letters, 2016, 14(7): 072501 Copy Citation Text show less
    (a) Silver dimer formed by a cuboid of 80 nm×160 nm×160 nm, (b)-(d) are schematics of three different excitations, (b) is the centered electric dipole, (c) is the centered magnetic dipole, and (d) is the 20 nm displaced electric dipole.
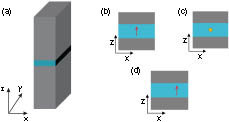
    Fig. 1. (a) Silver dimer formed by a cuboid of 80nm×160nm×160nm, (b)-(d) are schematics of three different excitations, (b) is the centered electric dipole, (c) is the centered magnetic dipole, and (d) is the 20 nm displaced electric dipole.
    (a) Spectra of the three excitations in the local model. blue line: the displaced electric excitation, red line: the center electric excitation, yellow line: the center magnetic excitation. (b) and (c) The spatial distributions of the electric field amplitude in the central xy plane of the gap of the displaced electric excitation at the peaks of 694 and 722 nm. (d) The spatial distribution of the electric field amplitude of the electric excitation at the peak of 695 nm. (e) The spatial distribution of the electric field amplitude of the magnetic excitation at the peak of 725 nm. (f) The normalized radiation pattern of the displaced electric excitation at 705 nm.
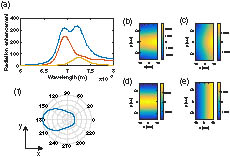
    Fig. 2. (a) Spectra of the three excitations in the local model. blue line: the displaced electric excitation, red line: the center electric excitation, yellow line: the center magnetic excitation. (b) and (c) The spatial distributions of the electric field amplitude in the central xy plane of the gap of the displaced electric excitation at the peaks of 694 and 722 nm. (d) The spatial distribution of the electric field amplitude of the electric excitation at the peak of 695 nm. (e) The spatial distribution of the electric field amplitude of the magnetic excitation at the peak of 725 nm. (f) The normalized radiation pattern of the displaced electric excitation at 705 nm.
    (a) and (b) Spectrum comparisons of the local (blue line) and nonlocal (red line) model for solely electric and magnetic excitation. (c) The same comparison for the displaced electric excitation. (d) The normalized radiation pattern of the displaced electric excitation at 695 nm in the nonlocal model.
    Fig. 3. (a) and (b) Spectrum comparisons of the local (blue line) and nonlocal (red line) model for solely electric and magnetic excitation. (c) The same comparison for the displaced electric excitation. (d) The normalized radiation pattern of the displaced electric excitation at 695 nm in the nonlocal model.
    (a) Wavelengths of the electric excited peaks in the local and nonlocal model and (b) is the corresponding radiation enhancement. (c) and (d) The same wavelength and enhancement results under magnetic excitation.
    Fig. 4. (a) Wavelengths of the electric excited peaks in the local and nonlocal model and (b) is the corresponding radiation enhancement. (c) and (d) The same wavelength and enhancement results under magnetic excitation.
    Relative changes between the local and nonlocal model of different structures and excitations. (a) and (b) Wavelength shifts and enhancement weakenings under electric excitation, and (c) and (d) are wavelength shifts and enhancement weakenings under magnetic excitation. Blue dots are the results of a 4 nm gap, red ones are of a 6 nm gap, yellow ones are of a 8 nm gap, and purple ones are of a 10 nm gap.
    Fig. 5. Relative changes between the local and nonlocal model of different structures and excitations. (a) and (b) Wavelength shifts and enhancement weakenings under electric excitation, and (c) and (d) are wavelength shifts and enhancement weakenings under magnetic excitation. Blue dots are the results of a 4 nm gap, red ones are of a 6 nm gap, yellow ones are of a 8 nm gap, and purple ones are of a 10 nm gap.
    Xianghao Zeng, Yong Wang, Yonghua Lu, Pei Wang. Nonlocal response of electric and magnetic modes in a silver cuboid dimer[J]. Chinese Optics Letters, 2016, 14(7): 072501
    Download Citation