• High Power Laser Science and Engineering
  • Vol. 9, Issue 4, 04000e59 (2021)
A. Laso Garcia1, H. Höppner1, A. Pelka1, C. Bähtz1, E. Brambrink2, S. Di Dio Cafiso1, J. Dreyer1, S. Göde2, M. Hassan1, T. Kluge1, J. Liu2, M. Makita2, D. Möller1, M. Nakatsutsumi2, T. R. Preston2, G. Priebe2, H.-P. Schlenvoigt1, J.-P. Schwinkendorf2, M. Šmíd1, A.-M. Talposi3, M. Toncian1, U. Zastrau2, U. Schramm1、4, T. E. Cowan1、4, and T. Toncian1、*
Author Affiliations
  • 1Helmholtz-Zentrum Dresden-Rossendorf, 01328Dresden, Germany
  • 2European XFEL, 22869Schenefeld, Germany
  • 3Extreme Light Infrastructure – Nuclear Physics and Faculty of Physics, University of Bucharest, 077126Magurele, Romania
  • 4Technische Universität Dresden, 01062Dresden, Germany
  • show less
    DOI: 10.1017/hpl.2021.47 Cite this Article Set citation alerts
    A. Laso Garcia, H. Höppner, A. Pelka, C. Bähtz, E. Brambrink, S. Di Dio Cafiso, J. Dreyer, S. Göde, M. Hassan, T. Kluge, J. Liu, M. Makita, D. Möller, M. Nakatsutsumi, T. R. Preston, G. Priebe, H.-P. Schlenvoigt, J.-P. Schwinkendorf, M. Šmíd, A.-M. Talposi, M. Toncian, U. Zastrau, U. Schramm, T. E. Cowan, T. Toncian. ReLaX: the Helmholtz International Beamline for Extreme Fields high-intensity short-pulse laser driver for relativistic laser–matter interaction and strong-field science using the high energy density instrument at the European X-ray free electron laser facility[J]. High Power Laser Science and Engineering, 2021, 9(4): 04000e59 Copy Citation Text show less
    View of the ReLaX laser chain installed in the laser room above the HED hutch; from left to right: optical compressor, TWIN main amplifier with pump-laser blocks and cryo-cooler, front end.
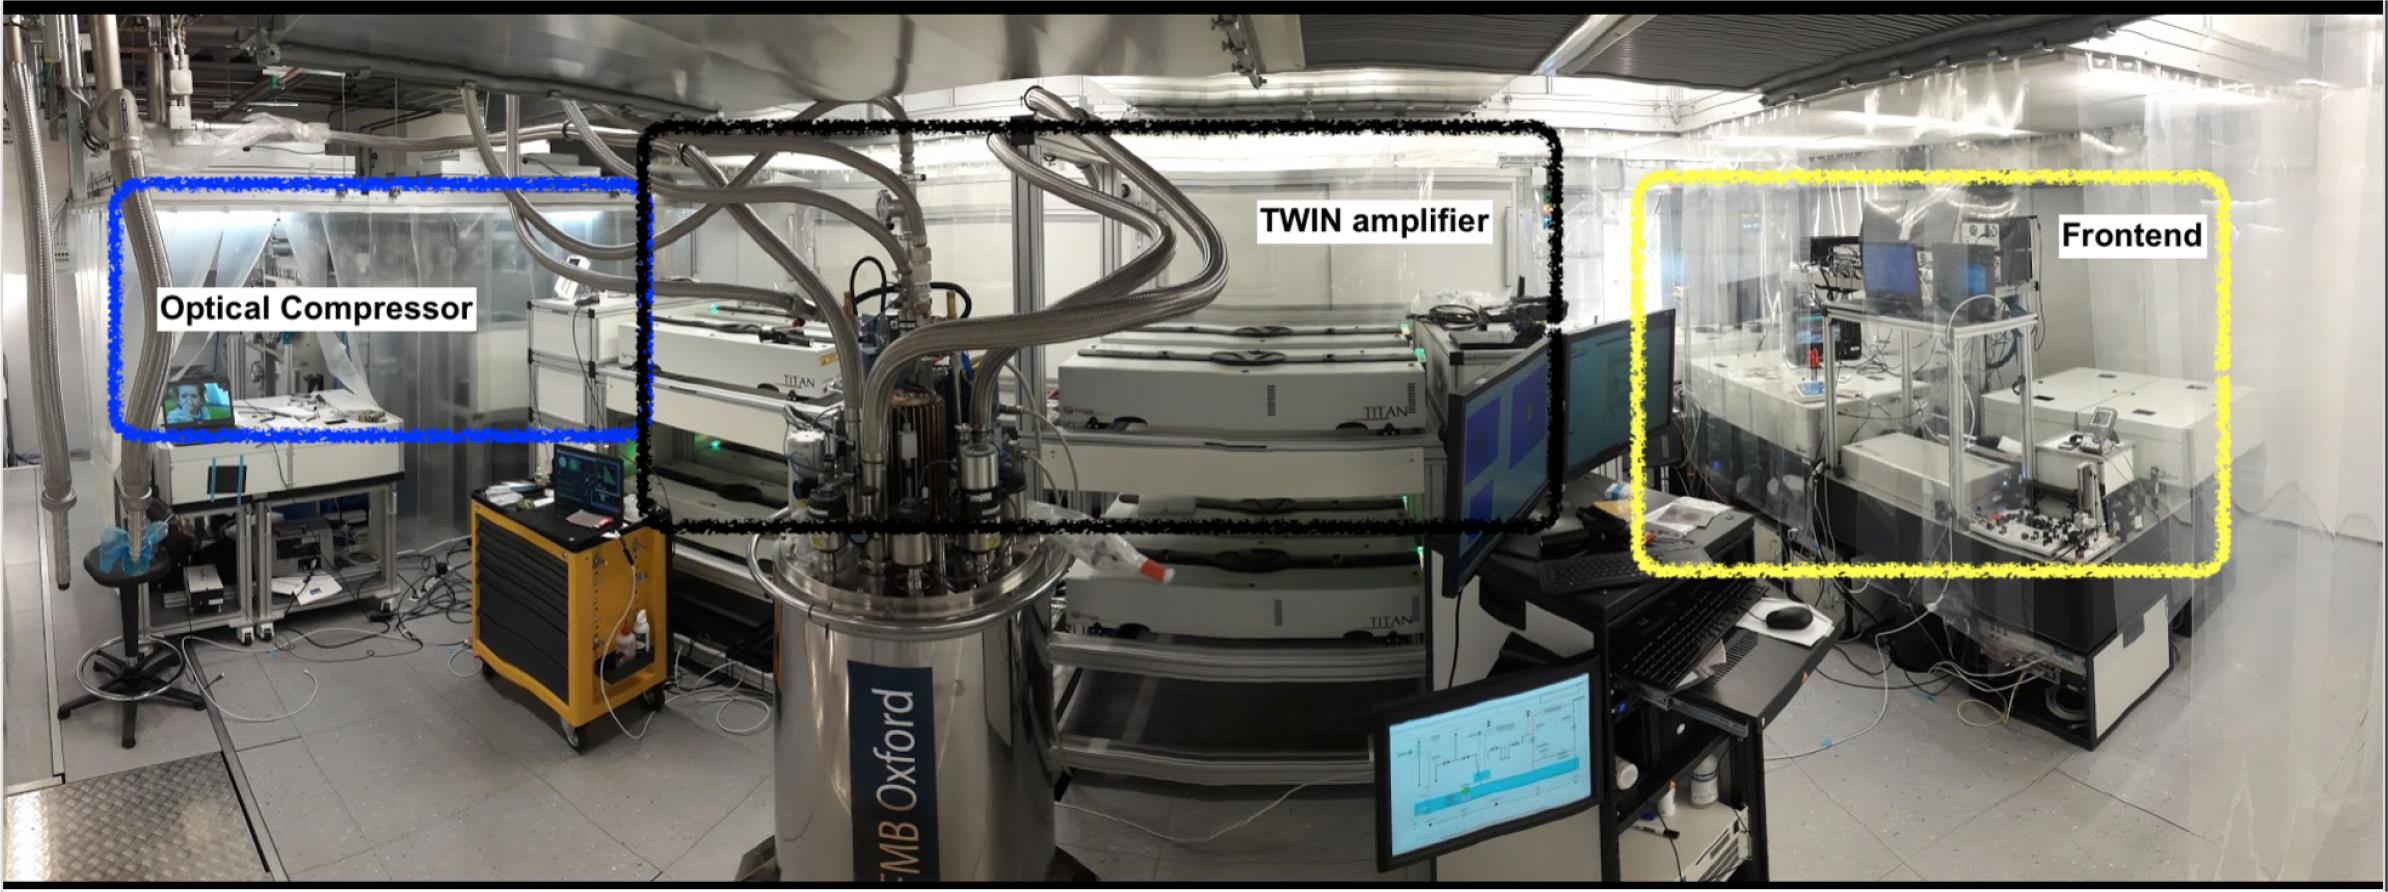
    Fig. 1. View of the ReLaX laser chain installed in the laser room above the HED hutch; from left to right: optical compressor, TWIN main amplifier with pump-laser blocks and cryo-cooler, front end.
    Setup and amplification scheme of the ReLaX laser chain; the pump lasers are shown in green boxes and the extracted infrared energies are given for maximal configuration.
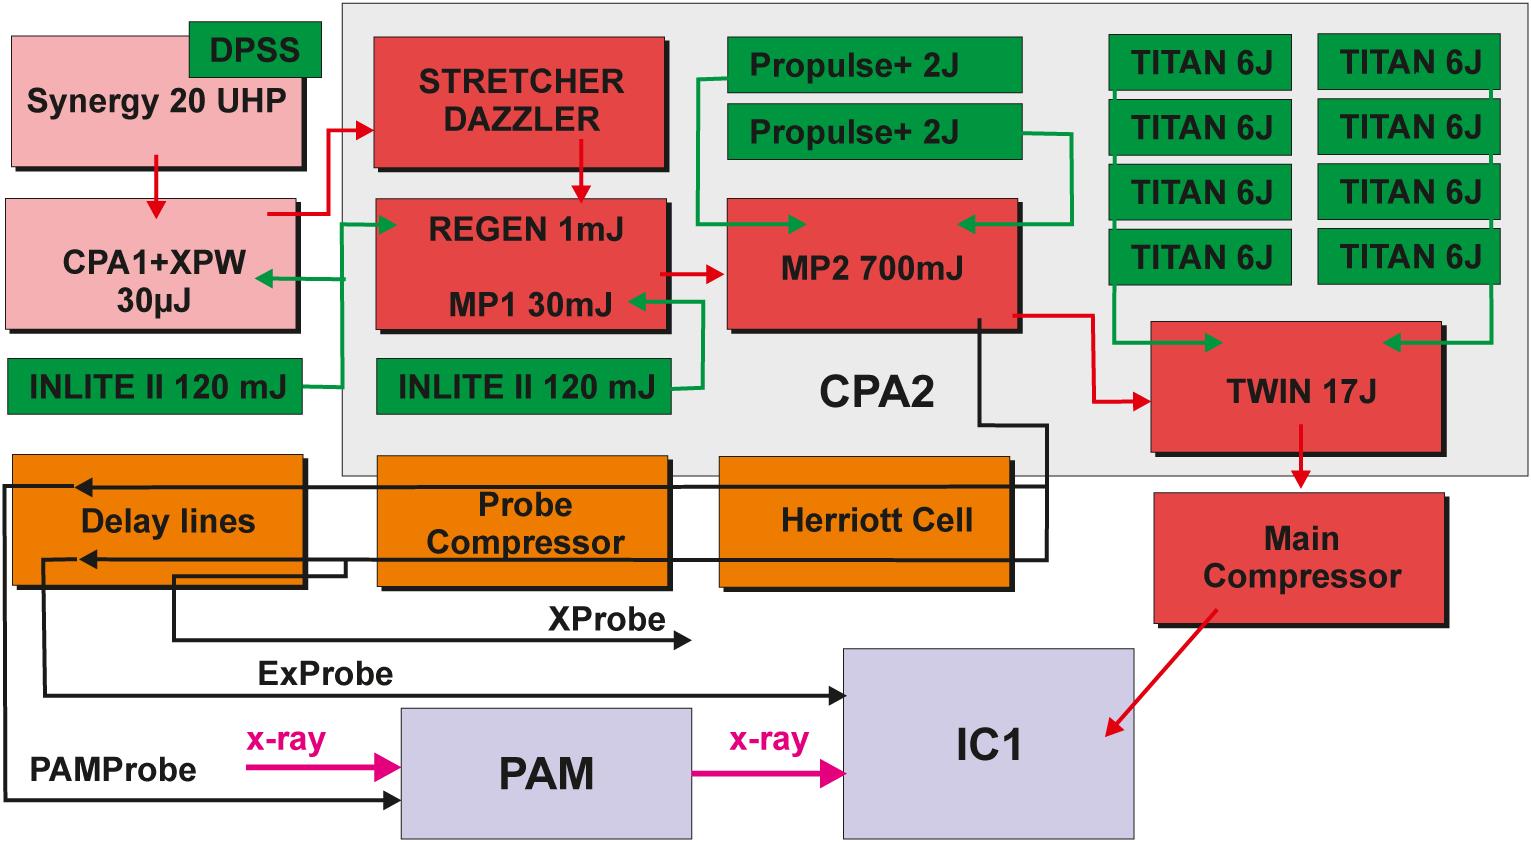
    Fig. 2. Setup and amplification scheme of the ReLaX laser chain; the pump lasers are shown in green boxes and the extracted infrared energies are given for maximal configuration.
    Evolution of the spectral amplitude throughout the amplifier chain.
    Fig. 3. Evolution of the spectral amplitude throughout the amplifier chain.
    Spectral amplitude and phase and resulting typical pulse at the end of the amplifier chain.
    Fig. 4. Spectral amplitude and phase and resulting typical pulse at the end of the amplifier chain.
    Temporal contrast measured for the main beam sampling the central sub-aperture at full MP2 energy.
    Fig. 5. Temporal contrast measured for the main beam sampling the central sub-aperture at full MP2 energy.
    Available experimental configurations allowing 0°, 90° and 45°crossing angles between the ReLaX and X-ray beams at IC1.
    Fig. 6. Available experimental configurations allowing 0°, 90° and 45°crossing angles between the ReLaX and X-ray beams at IC1.
    (a) Focal spot FWHM evolution. (b) Distribution of the calculated Strehl ratio from wavefront measurements.
    Fig. 7. (a) Focal spot FWHM evolution. (b) Distribution of the calculated Strehl ratio from wavefront measurements.
    Laser focal spot measured with the focal spot diagnostic. A defocus scan is shown as well as the typical far-field for three positions. The colour scale at 0 μm has been reduced by 2.3× compared with the other far-fields for visibility.
    Fig. 8. Laser focal spot measured with the focal spot diagnostic. A defocus scan is shown as well as the typical far-field for three positions. The colour scale at 0 μm has been reduced by 2.3× compared with the other far-fields for visibility.
    (a) Measured jitter RMS by the focal diagnostic in IC1 (ILM) and by the diagnostic table via far-field diagnostic (HIDG) in 10-minute slices. (b) Measured pointing drift by the same diagnostics in 10-minute slices.
    Fig. 9. (a) Measured jitter RMS by the focal diagnostic in IC1 (ILM) and by the diagnostic table via far-field diagnostic (HIDG) in 10-minute slices. (b) Measured pointing drift by the same diagnostics in 10-minute slices.
    (a) Typical image with absorption edge as measured at the PAM using a 4 μm thick Si3N4 substrate. The white lines indicate the integration area. Lower, the resulting PAM trace (blue) and its first derivative (red) are shown. The minimum of the derivative defines time zero. (b) The correlated results of the measured time-of-arrival timing between PAM and IC1 measurements with N = 2000 shots (3 minutes) and the individual histograms. (c) The measured arrival time traces measured at the PAM and IC1, and the extracted residual difference. The histogram below shows the distribution of the extracted residual difference, which is the temporal jitter between the ReLaX main and ReLaX PAM beams.
    Fig. 10. (a) Typical image with absorption edge as measured at the PAM using a 4 μm thick Si3N4 substrate. The white lines indicate the integration area. Lower, the resulting PAM trace (blue) and its first derivative (red) are shown. The minimum of the derivative defines time zero. (b) The correlated results of the measured time-of-arrival timing between PAM and IC1 measurements with N = 2000 shots (3 minutes) and the individual histograms. (c) The measured arrival time traces measured at the PAM and IC1, and the extracted residual difference. The histogram below shows the distribution of the extracted residual difference, which is the temporal jitter between the ReLaX main and ReLaX PAM beams.
    (a) Maximum proton energies as a function of defocusing distance. (b) RCF raw images of the proton beam. (c) Secondary radiation dose measured by a Ram Ion and integral of the EMP spectrum as a function of focal distance for a 2 μm Ti target.
    Fig. 11. (a) Maximum proton energies as a function of defocusing distance. (b) RCF raw images of the proton beam. (c) Secondary radiation dose measured by a Ram Ion and integral of the EMP spectrum as a function of focal distance for a 2 μm Ti target.
    Schematic depiction of a pump-probe experiment with ReLaX and XFEL and the associated diagnostics.
    Fig. 12. Schematic depiction of a pump-probe experiment with ReLaX and XFEL and the associated diagnostics.
    Energy deposit per pixel in the SAXS Jungfrau as a function of the distance to the flange.
    Fig. 13. Energy deposit per pixel in the SAXS Jungfrau as a function of the distance to the flange.
    Upper panel: SAXS signal recorded by the Jungfrau detector. The red squares show the areas where the SAXS signal and the backgrounds were averaged. In the lower right panel, the energy deposition per pixel due to secondary radiation is plotted. In the lower left, the lineout of the SAXS signal and the corresponding background levels are shown.
    Fig. 14. Upper panel: SAXS signal recorded by the Jungfrau detector. The red squares show the areas where the SAXS signal and the backgrounds were averaged. In the lower right panel, the energy deposition per pixel due to secondary radiation is plotted. In the lower left, the lineout of the SAXS signal and the corresponding background levels are shown.
    Left panel: PCI raw data of a 10 μm Cu wire while pumped by ReLaX. Right panel: expanded section of 100 × 100 pixels showing the salt-and-pepper noise.
    Fig. 15. Left panel: PCI raw data of a 10 μm Cu wire while pumped by ReLaX. Right panel: expanded section of 100 × 100 pixels showing the salt-and-pepper noise.
    X-ray signal recorded by the backwards X-ray spectrometer. Upper panel: Cu Kα emission when pumped by the XFEL beam at 9.7 keV. Lower panel: Cu Kα emission when pumped by ReLaX.
    Fig. 16. X-ray signal recorded by the backwards X-ray spectrometer. Upper panel: Cu Kα emission when pumped by the XFEL beam at 9.7 keV. Lower panel: Cu Kα emission when pumped by ReLaX.
    Normalized intensity of the recorded X-ray spectra.
    Fig. 17. Normalized intensity of the recorded X-ray spectra.
    A. Laso Garcia, H. Höppner, A. Pelka, C. Bähtz, E. Brambrink, S. Di Dio Cafiso, J. Dreyer, S. Göde, M. Hassan, T. Kluge, J. Liu, M. Makita, D. Möller, M. Nakatsutsumi, T. R. Preston, G. Priebe, H.-P. Schlenvoigt, J.-P. Schwinkendorf, M. Šmíd, A.-M. Talposi, M. Toncian, U. Zastrau, U. Schramm, T. E. Cowan, T. Toncian. ReLaX: the Helmholtz International Beamline for Extreme Fields high-intensity short-pulse laser driver for relativistic laser–matter interaction and strong-field science using the high energy density instrument at the European X-ray free electron laser facility[J]. High Power Laser Science and Engineering, 2021, 9(4): 04000e59
    Download Citation