
Weihang Zhang, Yinghao Ye, Lei Zeng, Enze Li, Jingyuan Peng, Dongsheng Ding, Baosen Shi. High-dimensional frequency conversion in a hot atomic system[J]. Chinese Optics Letters, 2023, 21(9): 092701
- Chinese Optics Letters
- Vol. 21, Issue 9, 092701 (2023)
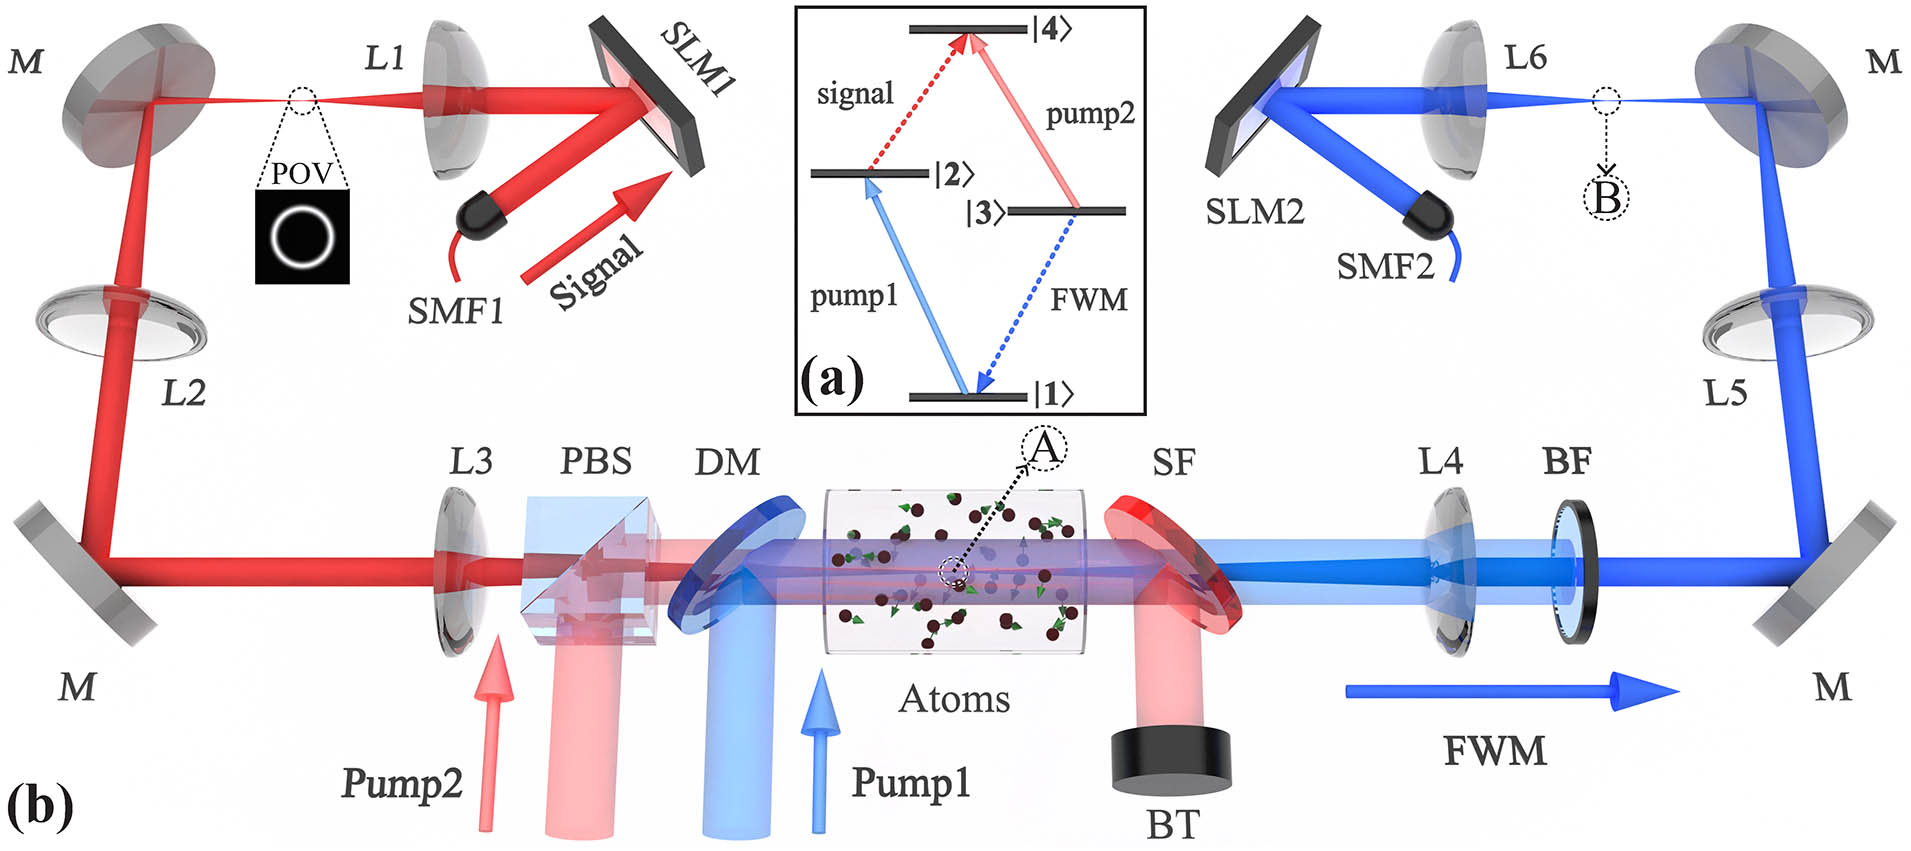
Fig. 1. (a) Energy diagram of the diamond configuration. (b) The schematic diagram of the experimental setup. SLM 1 and SLM 2, spatial light modulator; PBS, polarizing beam splitter; DM, long-pass dichroic mirror; SF, short-pass filter; BF, band-pass filter; BT, beam traps; SMF 1 and SMF 2, single-mode fiber; M, mirror. The focal lengths of lenses L1, L2, L3, L4, L5, and L6 are 75, 150, 150, 150, 150, and 75 mm, respectively.
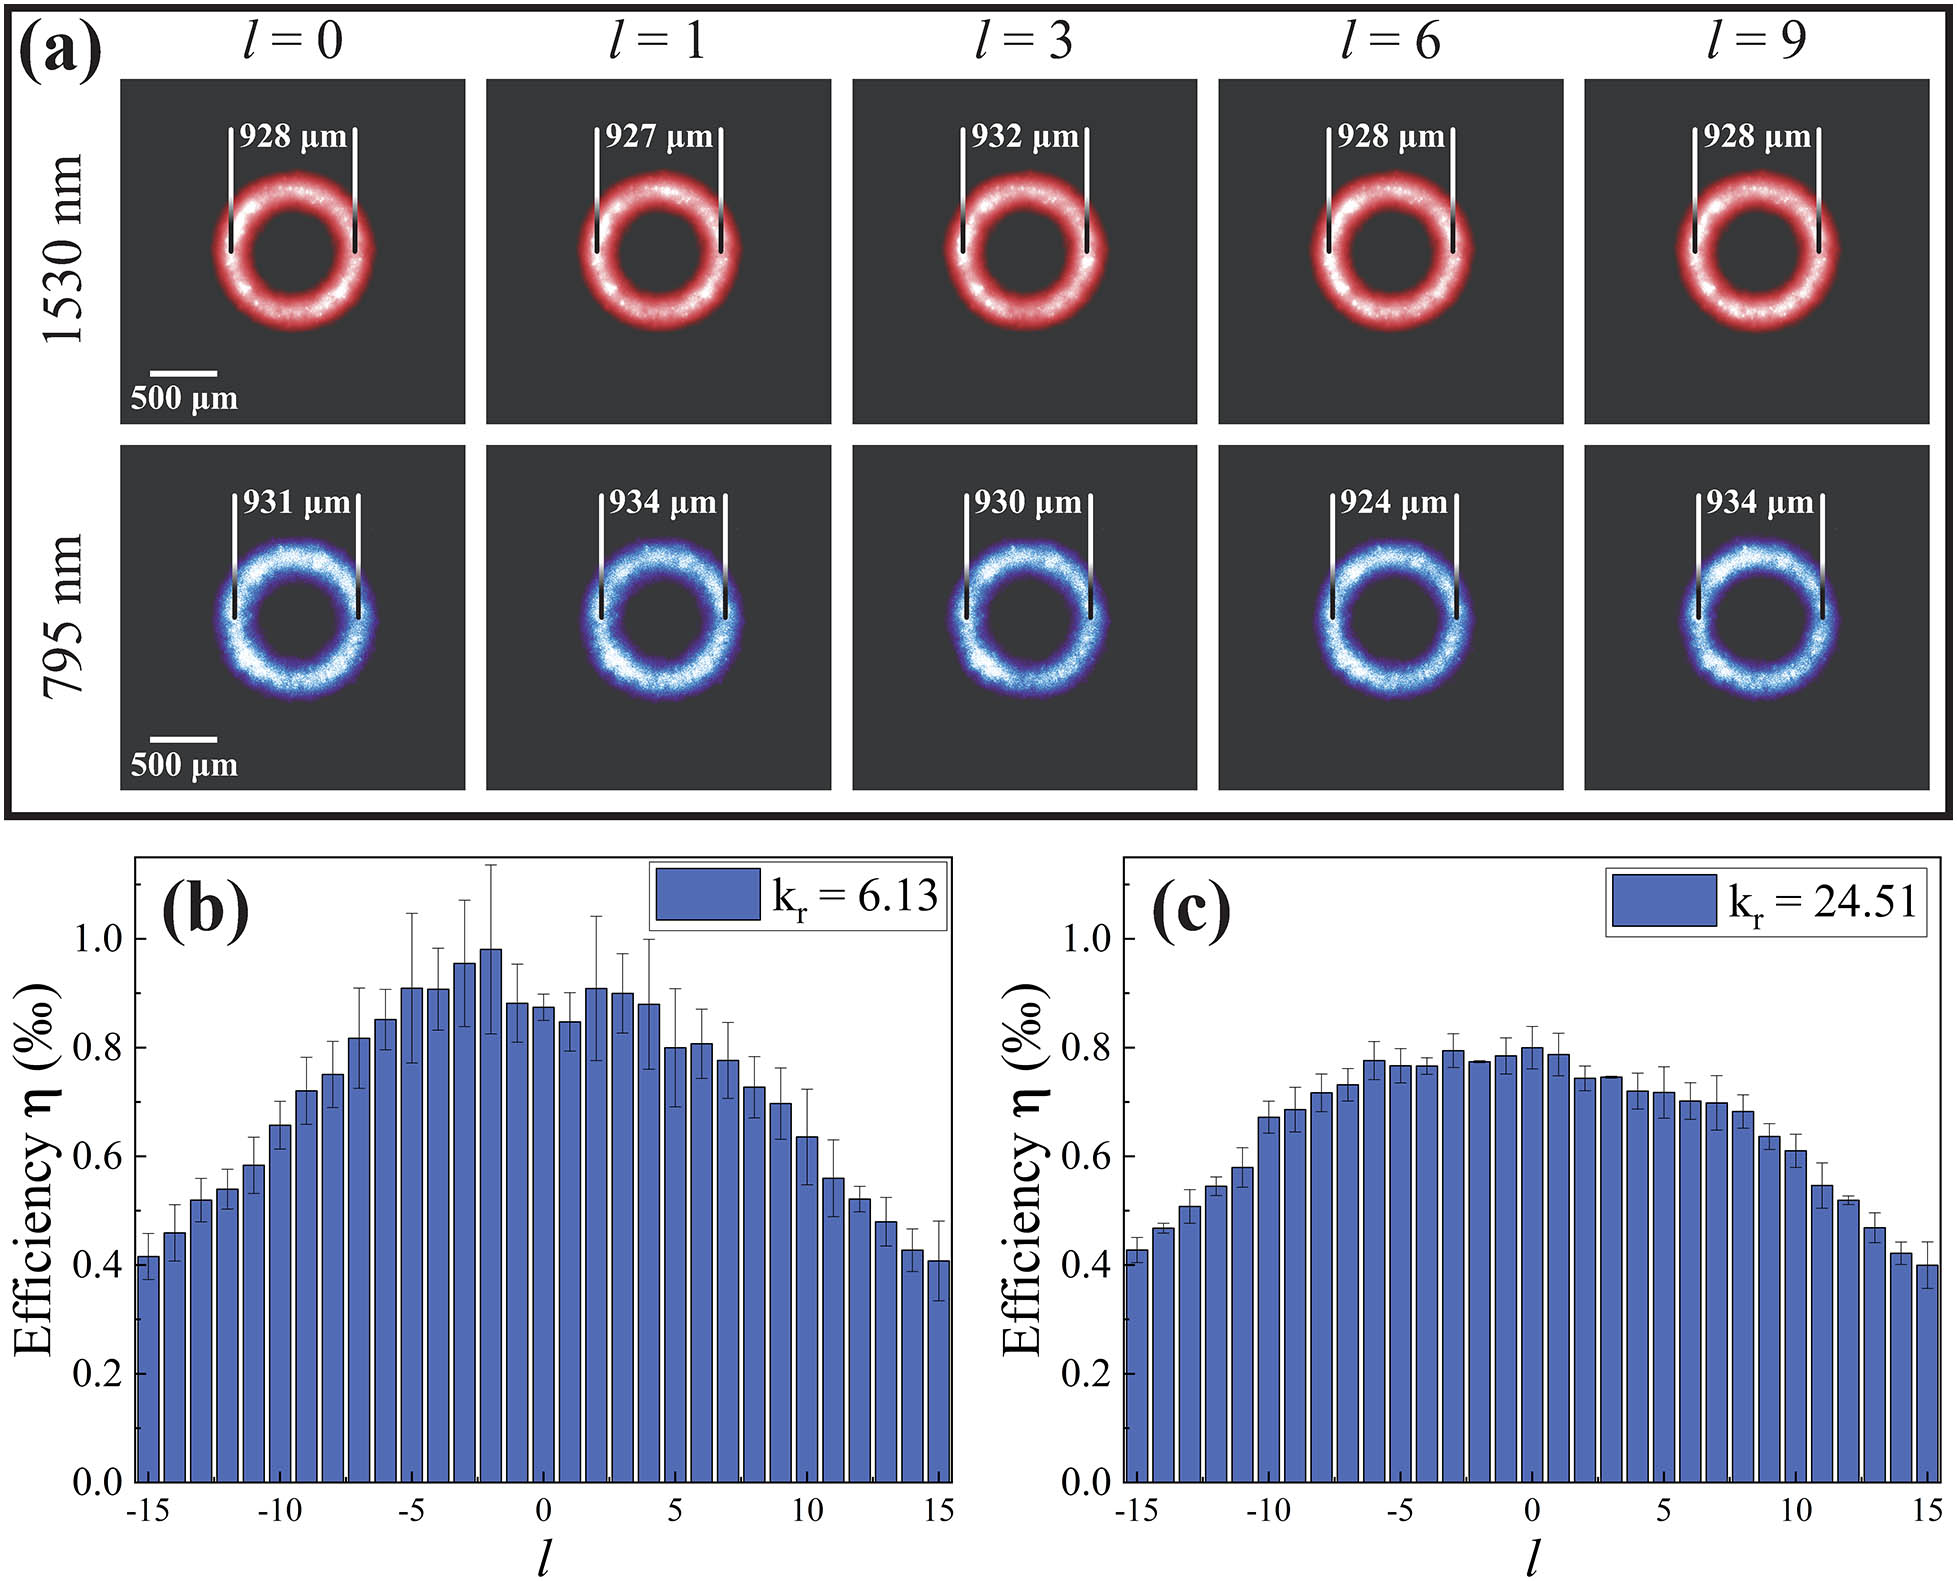
Fig. 2. (a) Intensity profiles of the input POV beams (red) and the converted POV beams (blue). (b),(c) The distribution of conversion efficiency η (unit is ‰) with different values of l in the case of kr = 6.13 mm−1 and kr = 24.51 mm−1. The η is estimated from the power and wavelength of lights before and after frequency conversion.
Fig. 3. (a) Cross-talk matrix between the input and the converted beams formed by the POV states in subspace {|−6〉,…,|6〉}. (b) The theoretical, input, and converted beam intensity profiles of four 2D states. (c) The real and imaginary parts of the reconstructed density matrix for the four 2D states.
Fig. 4. (a) The theoretical, input, and converted beam intensity profiles of the 3D, 5D, and 7D states. (b) The real and imaginary parts of the reconstructed density matrix for the 3D, 5D, and 7D states. (c) The distribution of conversion efficiency η with different states |Ψ〉, where |2D1〉 = (|0〉 + |6〉)/2, |2D2〉 = (|1〉 + |−5〉)/2, |2D3〉 = (|2〉 + |4〉)/2, |2D4〉 = (|−3〉 + |−6〉)/2, |3D〉 = (|−1〉+|3〉 + |−6〉)/3, |5D〉 = (|0〉 + |1〉 + |−3〉 + |−5〉 + |6〉)/5, and |7D〉 = (|0〉 + |−1〉 + |2〉 + |3〉 + |−4〉 + |5〉 + |−6〉)/7.

Set citation alerts for the article
Please enter your email address
© Copyright 2018-2021 | Chinese Laser Press. All Rights Reserved 沪ICP备15018463号-20