• Acta Geographica Sinica
  • Vol. 75, Issue 9, 1860 (2020)
Sida JIANG1, Wenfeng ZHAN1、2、*, Jun YANG3, Zihan LIU1, Fan HUANG1, Jiameng LAI1, Jiufeng LI1, Falu HONG1, Yuan HUANG4, Jike CHEN5, and Xuhui LEE6
Author Affiliations
  • 1Jiangsu Provincial Key Laboratory of Geographic Information Science and Technology, International Institute for Earth System Science, Nanjing University, Nanjing 210023, China
  • 2Jiangsu Center for Collaborative Innovation in Geographical Information Resource Development and Application, Nanjing 210023, China
  • 3Jiangho Architecture College, Northeastern University, Shenyang 110169, China
  • 4School of Architecture and Design, Southwest Jiaotong University, Chengdu 611756, China
  • 5School of Remote Sensing & Geomatics Engineering, Nanjing University of Information Science and Technology, Nanjing 210044, China
  • 6Yale-NUIST Center on Atmospheric Environment, Nanjing University of Information Science and Technology, Nanjing 210044, China
  • show less
    DOI: 10.11821/dlxb202009004 Cite this Article
    Sida JIANG, Wenfeng ZHAN, Jun YANG, Zihan LIU, Fan HUANG, Jiameng LAI, Jiufeng LI, Falu HONG, Yuan HUANG, Jike CHEN, Xuhui LEE. Urban heat island studies based on local climate zones: A systematic overview[J]. Acta Geographica Sinica, 2020, 75(9): 1860 Copy Citation Text show less
    Standard types of the LCZ scheme (modified from Stwart[12])
    Fig. 1. Standard types of the LCZ scheme (modified from Stwart[12])
    Global (a) and latitudinal (b) distributions of the cities where LCZ-based urban heat island has been investigated
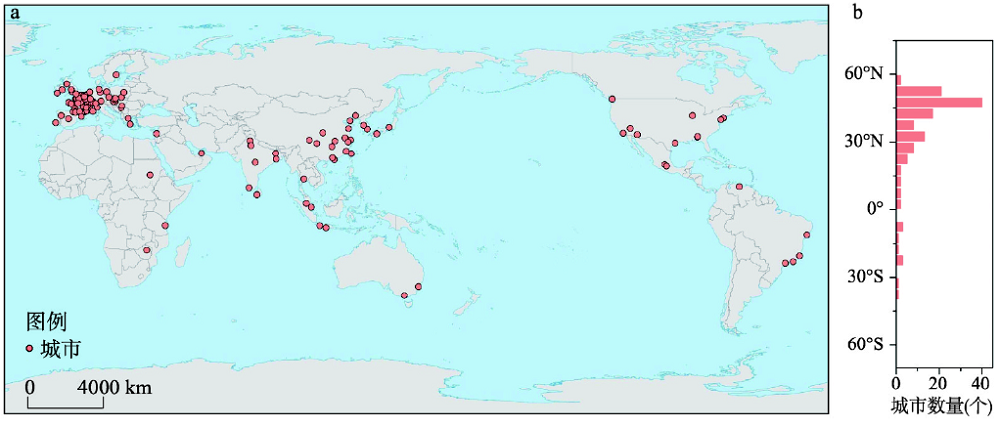
    Fig. 2. Global (a) and latitudinal (b) distributions of the cities where LCZ-based urban heat island has been investigated
    Comparison of literature number related to the LCZ-based UHI by year (2012-2019)
    Fig. 3. Comparison of literature number related to the LCZ-based UHI by year (2012-2019)
    Comparison of literature number that applies different approaches to obtain temperatures for LCZ-based UHI studies
    Fig. 4. Comparison of literature number that applies different approaches to obtain temperatures for LCZ-based UHI studies
    Land surface temperature difference between LCZs for 50 cities (row value minus column value) (Twill squares indicate no significant differences (significance level is 0.05 in K-S test) and the source data are from Bechtel[20]).
    Fig. 5. Land surface temperature difference between LCZs for 50 cities (row value minus column value) (Twill squares indicate no significant differences (significance level is 0.05 in K-S test) and the source data are from Bechtel[20]).
    The extreme values (maximum minus minimum) of the surface air temperature (white background) and land surface temperature (gray background) among LCZ types over various cities
    Fig. 6. The extreme values (maximum minus minimum) of the surface air temperature (white background) and land surface temperature (gray background) among LCZ types over various cities
    城市(国家)LCZ(Tmax)LCZ(Tmin)Tmax-Tmin(K)计算天数(d)背景气候*调查方法数据源
    安特卫普(比利时)293.220Cfb模型模拟表1[72]
    布鲁塞尔(比利时)293.115Cfb模型模拟表1[72]
    根特(比利时)292.016Cfb模型模拟表1[72]
    奥洛穆茨(捷克)292.41Cfb移动测量图3[73]
    柏林(德国)2D3.5-Cfb站点观测图7c[74]
    布拉干萨(葡萄牙)2RCD1.01460Csb站点观测图4[75]
    第戎(法国)251.81Cfb站点观测图10[76]
    南锡(法国)2D4.426Cfb移动测量表1[77]
    都柏林(爱尔兰)2D4.23Cfb移动测量图5[78]
    格拉斯哥(英国)3D2.7-Cfb站点观测图12[79]
    米兰(意大利)2D1.51Cfa站点观测表5[80]
    诺维萨德(塞尔维亚)2A2.01095Cfb站点观测图2[45]
    塞格德(匈牙利)2D4.812Cfb站点观测图7[81]
    乌普萨拉(瑞典)2D4.29Dfb移动测量图8[82]
    成都(中国)1BG2.43Cwa移动测量表2[83]
    重庆(中国)H20.92Cfa移动测量图8[84]
    南京(中国)24D3.178Cfa站点观测表3[85]
    台北(中国)1A3.31Cfa移动测量图5[86]
    香港(中国)196.12Cwa移动测量图7b[87]
    所有地区(新加坡)171.71Af模型模拟表9[88]
    部分地区(新加坡)492.05Af站点观测表2[89]
    长野(日本)24D3.79Cfa移动测量图3[82]
    科钦(印度)294.1-Am站点观测图3[90]
    那格浦尔(印度)362.57Aw站点观测表7[91]
    奥本(美国)3A2.67Cfa站点观测表3[92]
    奥佩莱卡(美国)3A2.27Cfa站点观测表2[92]
    温哥华(加拿大)1D4.64Csb移动测量图7[82]
    克雷塔罗城(墨西哥)2B4.9-Csa站点观测图8[93]
    圣保罗(巴西)3D3.85Cfb移动测量表3[94]
    Table 1. The extreme values of the surface air temperature among LCZ types over various cities (ranked by continent)
    城市(国家)数据LCZ(Tmax)LCZ(Tmin)Tmax-Tmin(K)计算天数(d)数据源
    布拉格(捷克)TIRS10A15.0*1图7f[17]
    布尔诺(捷克)TIRS10G18.0*1图6e[17]
    第戎(法国)TIRS8A11.0*1图11d[76]
    日内瓦(瑞士)TIRS2G12.0*1图6[95]
    塞格德(匈牙利)TIRS295.3*1表3[96]
    塞格德(匈牙利)热红外成像仪296.0*1图5[16]
    重庆(中国)TIRS1044.6*1图4a[97]
    福州(中国)TIRS8A14.21表3[98]
    杭州(中国)ASTERGA6.4*2图4[64]
    南京(中国)TIRS3G11.13图4[99]
    上海(中国)ASTERGD6.5*1图4[100]
    台北(中国)TIRS7G8.01图7[101]
    武汉(中国)TIRS3G14.0*1图4[102]
    珠江三角洲(中国)MODIS2G6.5*4图5e[103]
    昌迪加尔(印度)TIRS10G4.2*1图9[104]
    迪拜(阿联酋)MODIS2F4.6*-图14[105]
    曼谷(泰国)TIRS10G4.13图7[106]
    日惹(印度尼西亚)TIRSEB4.01表7[107]
    万隆(印度尼西亚)TIRS10A2.5*1图11[108]
    菲尼克斯(美国)ASTEREG25.61表6[109]
    拉斯维加斯(美国)ASTER7G16.81表6[109]
    圣保罗(巴西)MODIS3G9.5*-图6[110]
    哈拉雷(津巴布韦)TIRS2G19.43图4[111]
    悉尼(澳大利亚)热红外成像仪8A5.42图3[112]
    Table 2. The extreme values of the land surface temperature among LCZ types over various cities (ranked by continent)
    Sida JIANG, Wenfeng ZHAN, Jun YANG, Zihan LIU, Fan HUANG, Jiameng LAI, Jiufeng LI, Falu HONG, Yuan HUANG, Jike CHEN, Xuhui LEE. Urban heat island studies based on local climate zones: A systematic overview[J]. Acta Geographica Sinica, 2020, 75(9): 1860
    Download Citation