Author Affiliations
1Precision Optical Manufacturing and Testing Center, Shanghai Institute of Optics and Fine Mechanics, Chinese Academy of Sciences, Shanghai 201800, China2Key Laboratory for High Power Laser Material, Shanghai Institute of Optics and Fine Mechanics, Chinese Academy of Sciences Shanghai201800, China3Center of Material Science and Optoelectronics Engineering, University of Chinese Academy of Sciences, Beijing 100049, Chinashow less
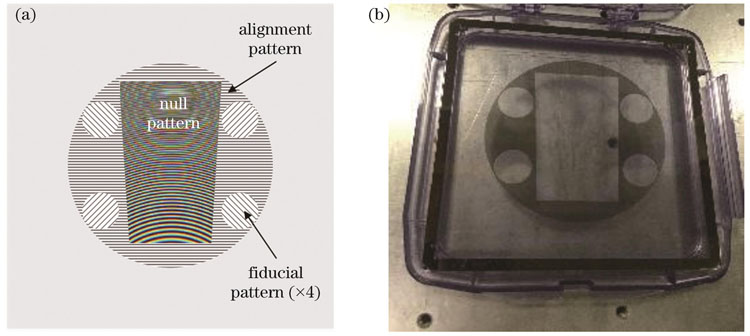
Fig. 1. CGH for null test. (a) Diffractive sections on CGH; (b) physical map of CGH
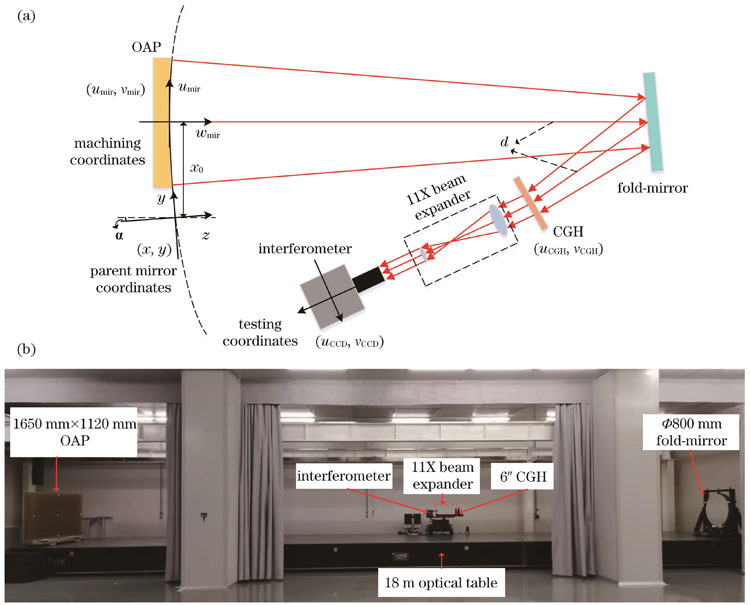
Fig. 2. Optical path of testing off-axis paraboloid mirror with CGH. (a) Schematic diagram of optical path; (b) photograph of optical path
Fig. 3. Comparison of results from different measurement methods. (a) Surface map measured by CMM (2 mm interpolation for data with scanning step of 10 mm); (b) surface map measured by interferometer
Fig. 4. Transmitted wavefront error of the CGH substrate over the clear aperture
Fig. 5. Transmitted wavefront error of beam expanding system. (a) Theoretical transmitted wavefront error (spherical aberration); (b) transmitted wavefront error over the clear aperture after polishing(after removing power)
Fig. 6. Figure error of Φ800 mm fold-mirror in measuring optical path. (a) Figure error (90% clear aperture); (b) figure error of effective measurement area
Fig. 7. Positioning error of Φ800 mm fold-mirror. (a) Translation (5 mm, 5 mm); (b) rotation 0.5°
Fig. 8. System error of measuring optical path
Fig. 9. Flow chart of distortion correction
Fig. 10. Distortion correction error
Fig. 11. Iterative polishing results. (a) Surface map before distortion correction; (b) surface map after distortion correction; (c) 1650 mm×1120 mm off-axis paraboloid mirror
Optical parameter | Value | Note |
---|
Aperture | 1650 mm×1120 mm | | Material | Glass ceramics | | Vertex radius of curvature | 2.4×104 mm | | Off-axis distance | 2000 mm | Distance from the parent vertex | Conic constant | -1 | Parabola | Aspheric departure | 118 μm | Astigmatic peak-to-valley departure | Measure method | Null test with standard plane mirror | |
|
Table 1. Optical design prescription of OAP mirror
Specification | Value |
---|
Description | Vibration insensitive dynamic Twyman-Green interferometer | Acquisition mode | Instantaneous phase shifting with pixelated phase sensor | Beam diameter | 9 mm collimated FWHM | Focus range /mm | ±12.5 | Minimum exposure /μs | 30 | RMS repeatability | <0.001λ | RMS precision | <0.002λ |
|
Table 2. Main specifications of PhaseCam 6000
Surface | Radius /mm | Thickness /mm | Glass | Semi-diameter /mm | Conic constant |
---|
OBJ | INF | INF | | 60.00 | | 1 | 260.20 | 20.00 | SILICA | 60.00 | | 2 | INF | 603.86 | | 60.00 | -0.636 | 3 | 50.60 | | N-BK7 | 12.70 | | 4 | -50.60 | | | 12.70 | | IMA | | INF | | 4.36 | |
|
Table 3. Optical design parameters of beam expander
Design and fabrication contributor | Figure error RMS |
---|
| Design residual | 0.1 | Wavelength uncertainty of 0.002 nm | 0.1 | Encoding error | 0.5 | Patterning error(10 nm RMS in one direction) | 0 | Etching uniformity error | 0 | Substrate thickness | 0 | Substrate wedge(1.5 µrad) | 0 | Substrate index error of 0.0001 | 0 | CGH substrate deformation error / design(the same deformation on both faces,that is not seen in the transmission measurement). Assumes 1 μm sag over 140 mm diameter | 0 | | Total RSS | 0.5 |
|
Table 4. CGH design and fabrication error budget
Measuring component contributor | Figure error RMS /nm |
---|
Total RSS | <5.4 | Interferometer | <1.2 | Beam expanding system(remove after calibration) | <0.7 | CGH(remove after calibration) | 0.5 | Flod mirror(5° reflecting angle,remove after calibration) | <5.2 |
|
Table 5. Measurement error budget
No. | Marked points /mm | Deviation /mm |
---|
umir | vmir | uCCD | vCCD | uerr | verr | ρerr |
---|
1 | 0 | 0 | 652.12 | 600.52 | 0.00 | 0.39 | 0.39 | 2 | 0 | -510 | 645.63 | 365.70 | 0.58 | 0.64 | 0.86 | 3 | 0 | 510 | 647.73 | 835.50 | 0.78 | -0.11 | 0.78 | 4 | 775 | 0 | 196.70 | 603.01 | 1.82 | -0.37 | 1.86 | 5 | 775 | 0 | 1036.20 | 598.19 | 1.08 | 1.64 | 1.96 | 6 | 775 | 510 | 1034.30 | 821.00 | 0.84 | 0.64 | 1.05 | 7 | 775 | -510 | 1033.10 | 376.40 | -1.07 | 0.39 | 1.14 | 8 | 775 | -510 | 189.80 | 350.00 | -0.23 | -0.57 | 0.62 | 9 | 775 | 510 | 192.60 | 856.10 | -0.94 | -0.27 | 0.98 | Max deviation | 1.82 | 1.64 | 1.96 | RMS | 0.95 | 0.69 | 1.18 |
|
Table 6. Position deviation of marked points