• Acta Photonica Sinica
  • Vol. 51, Issue 6, 0622001 (2022)
Chen TIAN1、2, Peng CHEN1、2, Xiaojie ZHANG3, Huabao LONG3, Mingyang HOU4, and Zhengxiang SHEN1、2、*
Author Affiliations
  • 1Key Laboratory of Advanced Micro-Structure Materials,Ministry of Education,Tongji University,Shanghai 200092,China
  • 2Institute of Precision Optical Engineering,School of Physics Science and Engineering,Tongji University,Shanghai 200092,China
  • 3Shanghai Aerospace Control Technology Institute,Shanghai 201109,China
  • 4Beijing Institute of Space Mechanics & Electricity,Beijing 100190,China
  • show less
    DOI: 10.3788/gzxb20225106.0622001 Cite this Article
    Chen TIAN, Peng CHEN, Xiaojie ZHANG, Huabao LONG, Mingyang HOU, Zhengxiang SHEN. Manufacturing of Infrared Polarization Imaging Optical System Based on Micro-scanning[J]. Acta Photonica Sinica, 2022, 51(6): 0622001 Copy Citation Text show less
    Schematic diagram of micro-scanning technology imaging
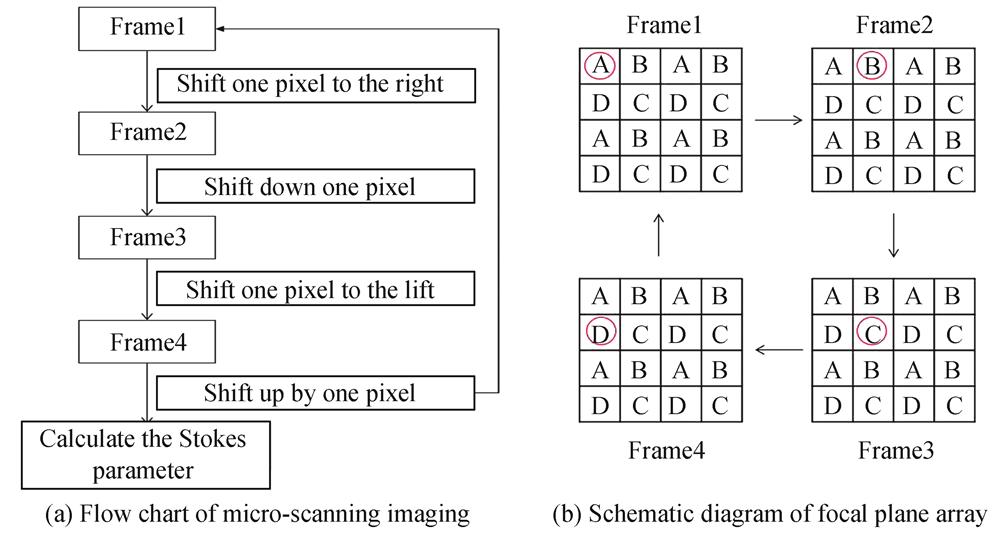
    Fig. 1. Schematic diagram of micro-scanning technology imaging
    Optical path of the system
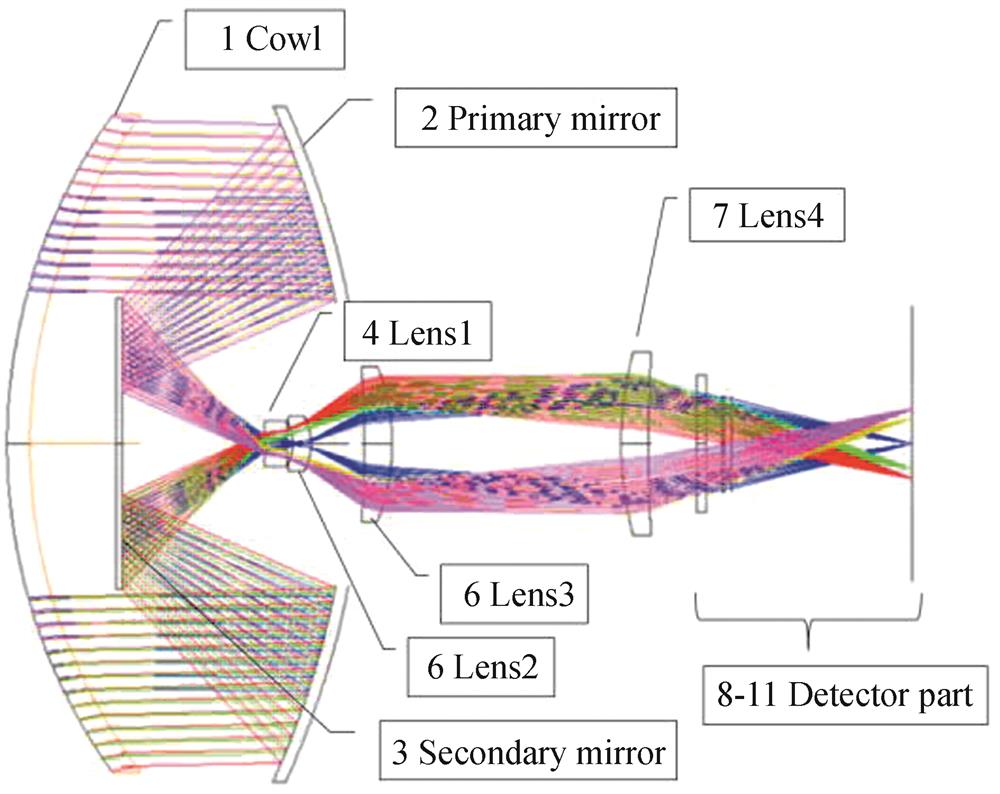
    Fig. 2. Optical path of the system
    MTF of the system
    Fig. 3. MTF of the system
    Spot diagram of the system
    Fig. 4. Spot diagram of the system
    Result of Monte Carlo simulation
    Fig. 5. Result of Monte Carlo simulation
    MTF of the system at different micro-scanning positions
    Fig. 6. MTF of the system at different micro-scanning positions
    MTF changes with the decenter of the micro-scanning lens in the X and Y directions
    Fig. 7. MTF changes with the decenter of the micro-scanning lens in the X and Y directions
    MTF changes with the tilt of the micro-scanning lens in the X and Y directions
    Fig. 8. MTF changes with the tilt of the micro-scanning lens in the X and Y directions
    Spot diagrams of the system at different micro-scanning positions
    Fig. 9. Spot diagrams of the system at different micro-scanning positions
    The relationship curve between lens displacement and focus displacement
    Fig. 10. The relationship curve between lens displacement and focus displacement
    3D cross-sectional view of the imaging system
    Fig. 11. 3D cross-sectional view of the imaging system
    Physical image of the imaging system
    Fig. 12. Physical image of the imaging system
    Original image
    Fig. 13. Original image
    The images of each polarization direction and infrared intensity
    Fig. 14. The images of each polarization direction and infrared intensity
    Image of degree of polarization
    Fig. 15. Image of degree of polarization
    ParameterValue
    Wavelength3~5 μm
    Fieldϕ4°(3.13°×2.51°)
    F/#2±0.1
    Apertureϕ40 mm
    Table 1. Parameters of optical system
    NameRadius/mmConicThickness/mmGlass
    1Cowl

    62

    59

    -

    -

    2.5MgF2
    2M1-81.698-1.056-Mirror
    3M2--Mirror
    4Lens1

    -5.034

    98.703

    1.872

    -

    2.5Ge
    5Lens2

    -11.19

    -6.373

    4.899

    -

    2Ge
    6Lens3

    -43.311

    -22.853

    -2.865

    -

    3Silicon
    7Lens4

    38.482

    175.268

    -

    -

    3Silicon
    8Window-1Ge
    9Filter-0.3Ge
    10Diaphragm---
    11Image surface---
    Table 2. Lens data of optical system design
    ParameterValue
    Radius/fringe1
    Thickness/μm13
    Decenter/μm13
    Tilt/(′)0.9
    Table 3. Tolerance limits
    ImageOriginal image0° image45° image90° imageIntensity imageDegree of polarization image
    Contrast11.3680.92100.9977.07108.73115.83
    Table 4. Contrast analysis results of images
    Chen TIAN, Peng CHEN, Xiaojie ZHANG, Huabao LONG, Mingyang HOU, Zhengxiang SHEN. Manufacturing of Infrared Polarization Imaging Optical System Based on Micro-scanning[J]. Acta Photonica Sinica, 2022, 51(6): 0622001
    Download Citation