
Yimunan XIE, Xiaoping JIANG, Sumei ZHOU, Zhe YUAN. Effect on the Optical Properties of Planar Microlens Arrays with Different Ion-exchange Time[J]. Acta Photonica Sinica, 2022, 51(1): 0151121
- Acta Photonica Sinica
- Vol. 51, Issue 1, 0151121 (2022)
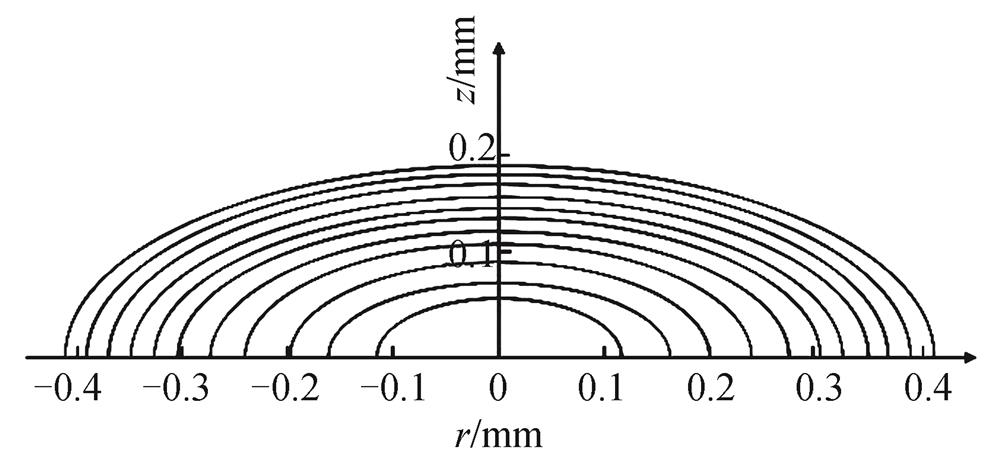
Fig. 1. Computer simulation of refractive index distribution curve based on measured data
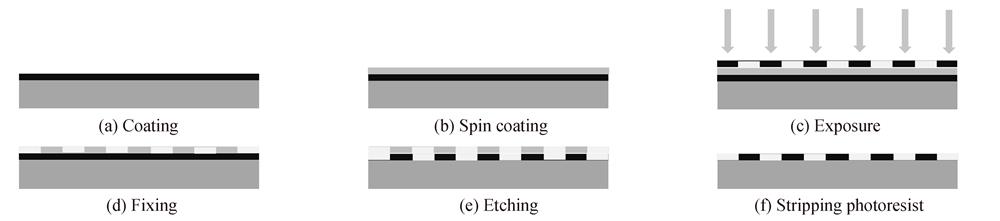
Fig. 2. Schematic diagram of the main process flow
Fig. 3. Schematic diagram of ion-diffusion into glass through openings
Fig. 4. Cross section of ion-exchange area of typed C01 microlens array and imaging of letter "A"
Fig. 5. Cross section of ion-exchange area of typed C02 microlens array and imaging of letter "A"
Fig. 6. Average ion-diffusion rate of GRIN planar microlens array
Fig. 7. Average ion-diffusion rate of the typed C01 and typed C02 plane microlens array in the z-direction and r-direction
Fig. 8. Schematic diagram of test principle
Fig. 9. The focal length vs. time diagram GRIN planar microlens array
Fig. 10. Imaging of quadrille paper from GRIN planar microlens array
|
Table 1. The geometric structure parameters of the two mask template patterns
|
Table 2. Ion-exchange width and depth ratio of typed C01 microlens array
|
Table 3. Ion-exchange width and depth ratio of typed C02 microlens array
|
Table 4. Numerical aperture and distortion of typed C01 microlens array
|
Table 5. Numerical aperture and distortion of typed C02 microlens array


Set citation alerts for the article
Please enter your email address

© Copyright 2018-2021 | Chinese Laser Press. All Rights Reserved 沪ICP备15018463号-20